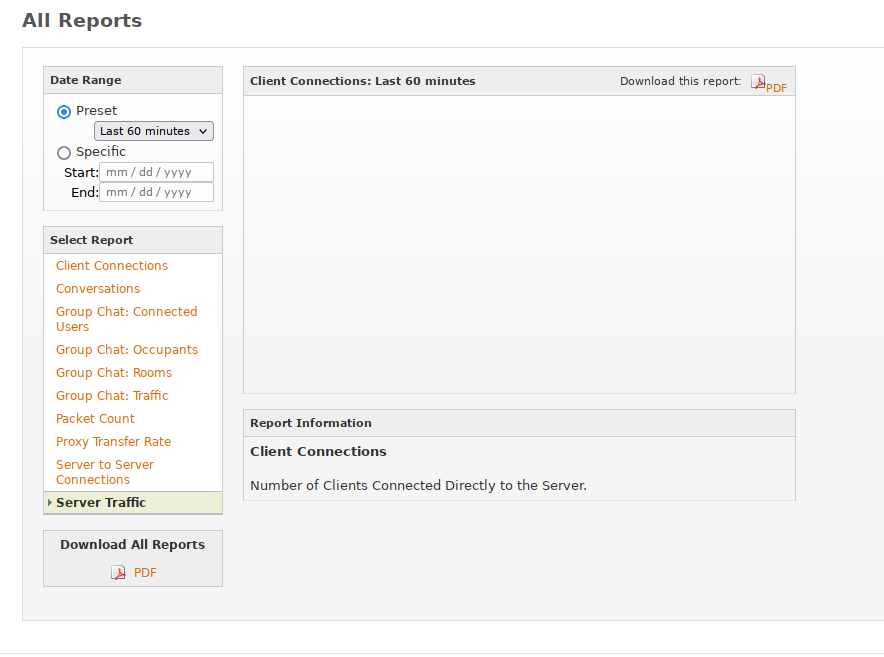
In the Statistics => All Reports tab, only the “Client Connections” and “Group Chat: Traffic” reports work. When I select a different report from the list, the area where the graph should show up stays empty, and the header of the graph and the description below still show the name of the last report that worked. Note that in the following screenshot, I selected “Server Traffic” from the report list, but the header of the graph as well as the description below still say “Client Connections”:
I’m currently running Openfire 4.7.4 with the Monitoring Service 2.4.0 plugin, but this has also never worked in any of the previous versions I used (back to Openfire 4.5.1, I think).
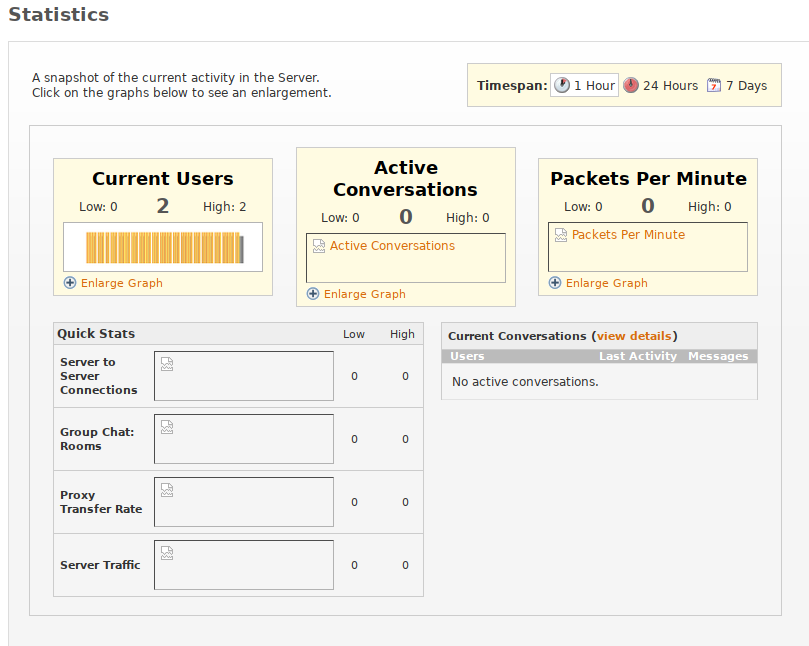
Weird, they show for me with Openfire 4.7.4 and Monitoring Service 2.4.0 (there are some bugs in this combination, but graphs should be shown on the admin console).
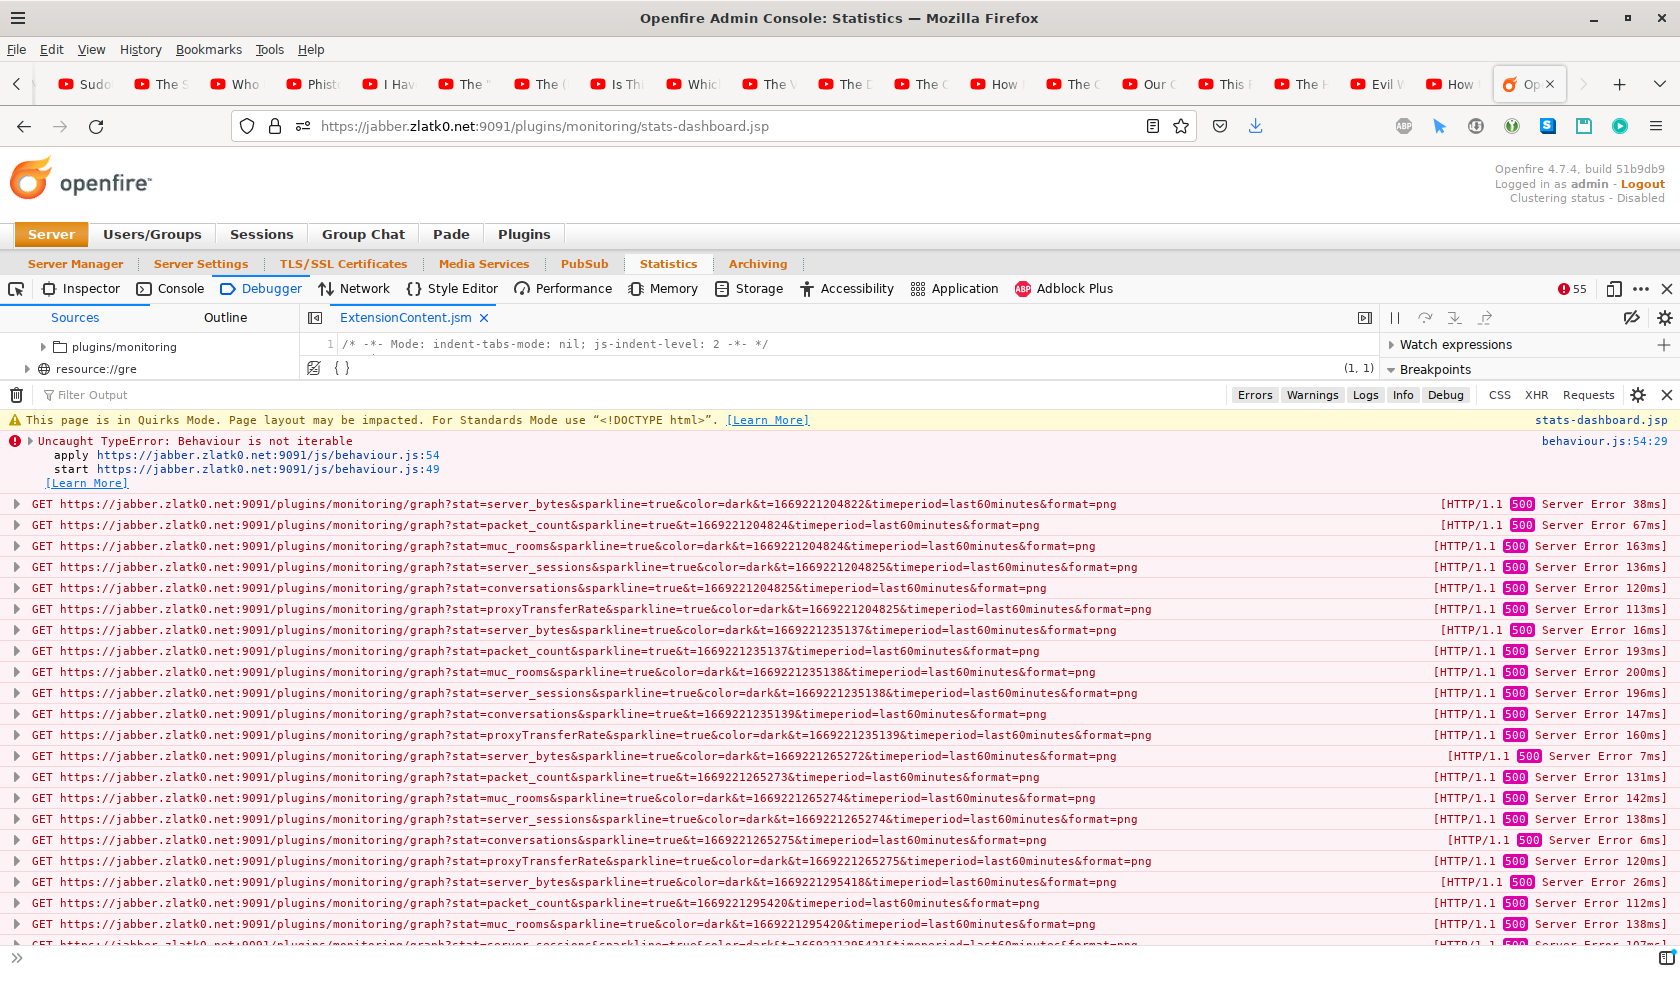
Can you check the browser’s development console for clues? I suspect that you’ll see some kind of HTTP error when the graphs are requested.
Please check the Openfire logs too. Hopefully, a clue is logged in there.
Well, I thought as much, I didn’t think you’d knowingly release Openfire with a buggy statistics tab.
This looks a bit suspicious, no? Unfortunately I’m not really familiar with the browser debugging console, so I have no idea what/where exactly to look for:
It is likely that those issues are related. It appears that your RRDs got corrupted, somehow. I can’t explain why, but you probably need to get rid of them manually. I’ve provided instructions in the original post.


 I answered in the original post where you provided the instructions.