Hello, developers of openfire,I’m a friend from China.The following content has been translated by Google and may not be very readable. Please forgive me.
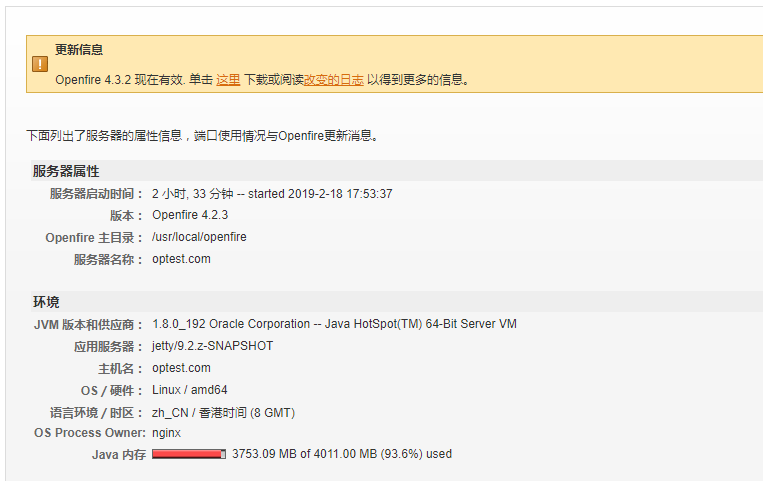
My openfire server has recently suffered from a JVM memory overflow problem, which is that memory only increases and does not decrease. My settings are 4G and xmpp. pep. enabled = false on the console. But when I just used several users to send single messages at the same time, the server’s memory kept increasing until the server was abnormal.
I’m using Openfire 4.2.3, and I’d like to find a solution. I hope it can help me. Thank you!
Unless you are using many (more than 1000) users that are generating above-average data, this should not happen.
Are you using custom code (plugins, or other modifications)?
Have you tried creating a Java heap dump? You can use that to determine what instances are using up all your memory.
Thank you very much for your reply.
In this test, I just used the chat part. It’s not about my custom plugins.
My server has been running for 78 days, which is the latest problem. I suspect it was caused by my modification (plug-in). But the server has been running steadily for 78 days. Now, after restarting the server for two days, there will be a memory overflow that will cause the server to not work properly.
I don’t quite understand how to creating a Java heap dump,I’ll give it a try.
In addition to all the custom plug-ins, I also removed the Packet Filter plug-in that performs database operations when sending messages.
After restarting the server, I did a stress test again. Three users logged in, sent messages, once a second. Then the server memory kept increasing until the server did not work properly (java. lang. OutOfMemoryError: GC overhead limit exceeded)
This is my plug-in situation.
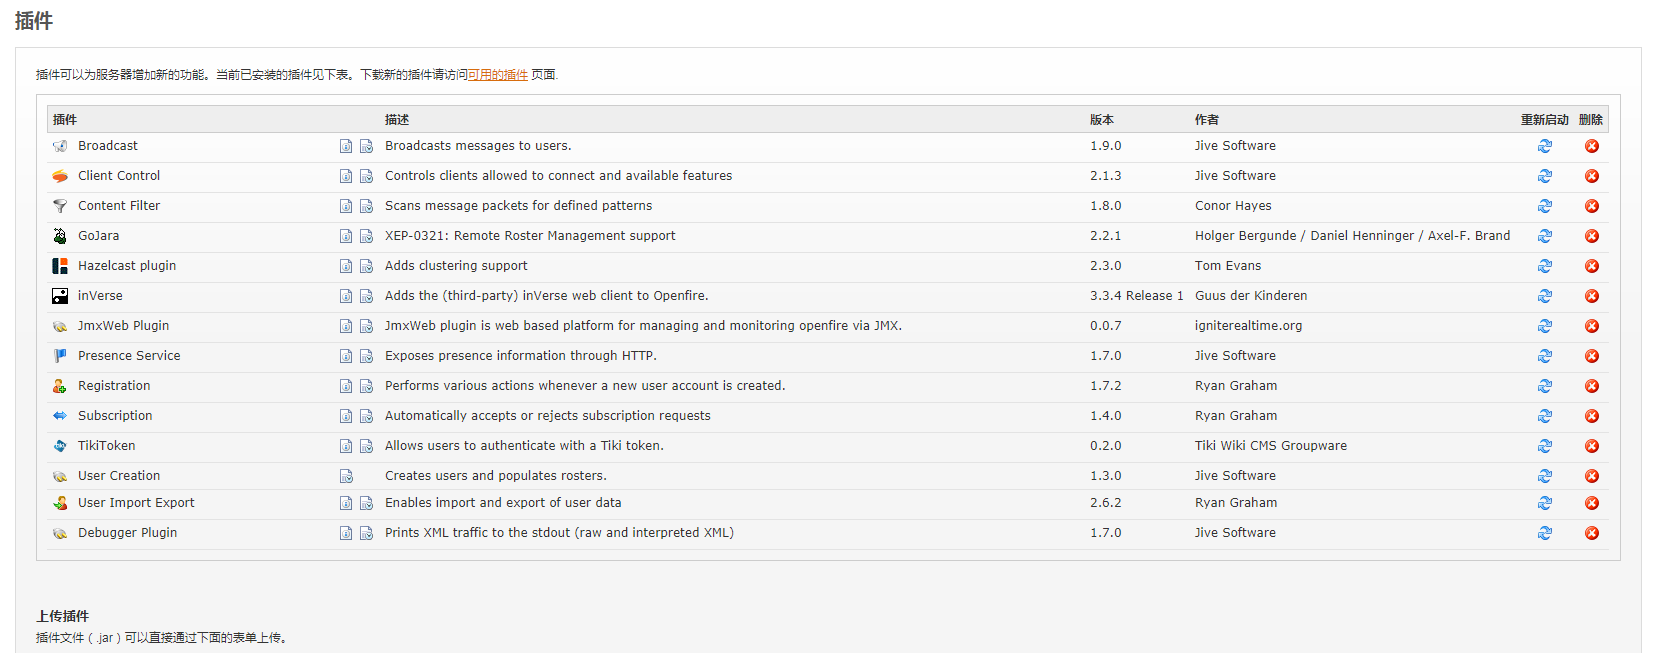
Do you really need all of them. Try removing them all, then test. If it works ok, add them one by one testing every time. Maybe then you will find if one of them is causing these memory issues.
I doubt if you really need all those plugins, but regardless, the memory leak should not occur.
Please create a Java heap dump. We can use that to detect where all memory is being used.
This is what I monitored with JProfiler. Is it caused by thread blocking? After I stopped sending message test, there is still message sending (waiting)?
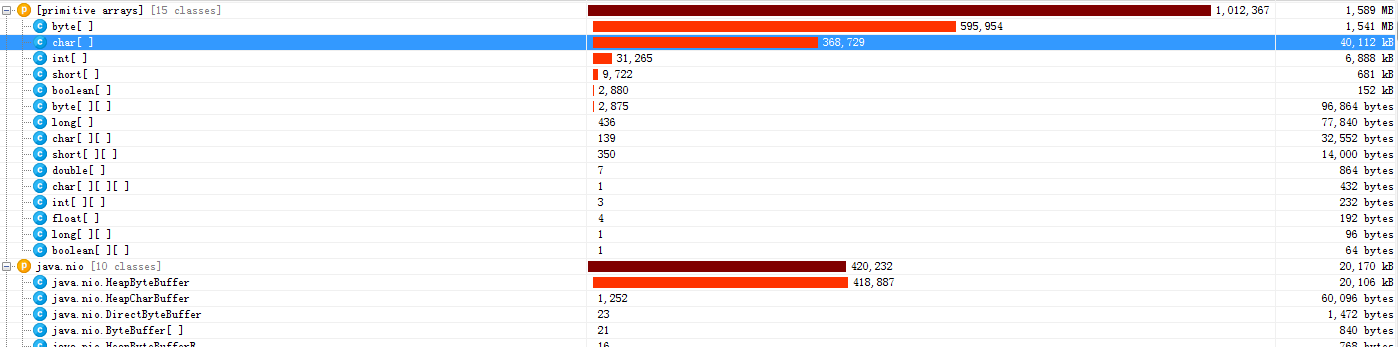
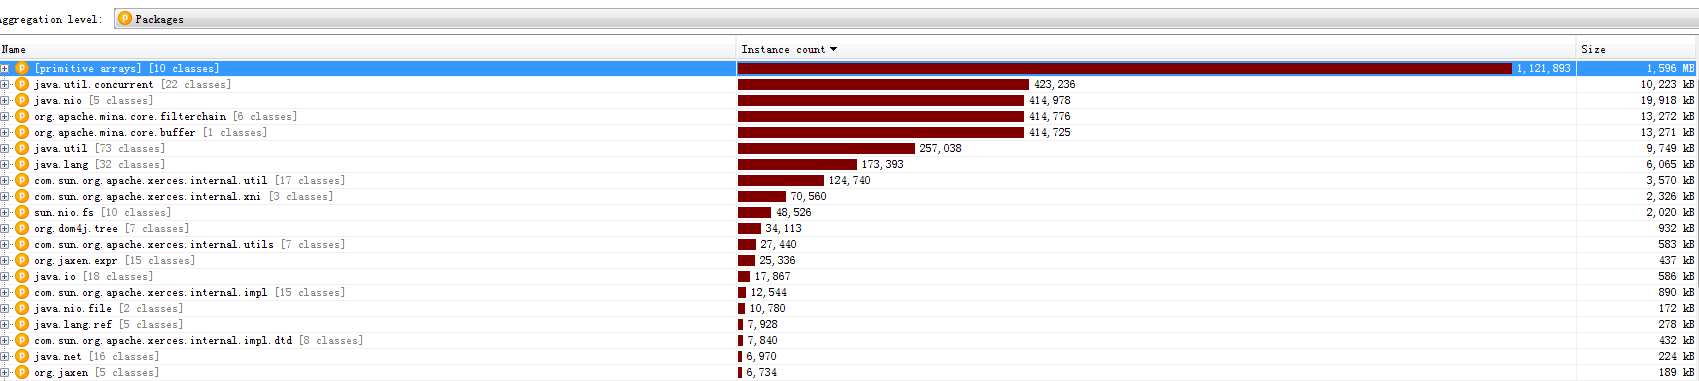
It might be to early tell. Also, although this graph shows what instances are kept in memory, it does show what references prevent those instances from being garbage collected.
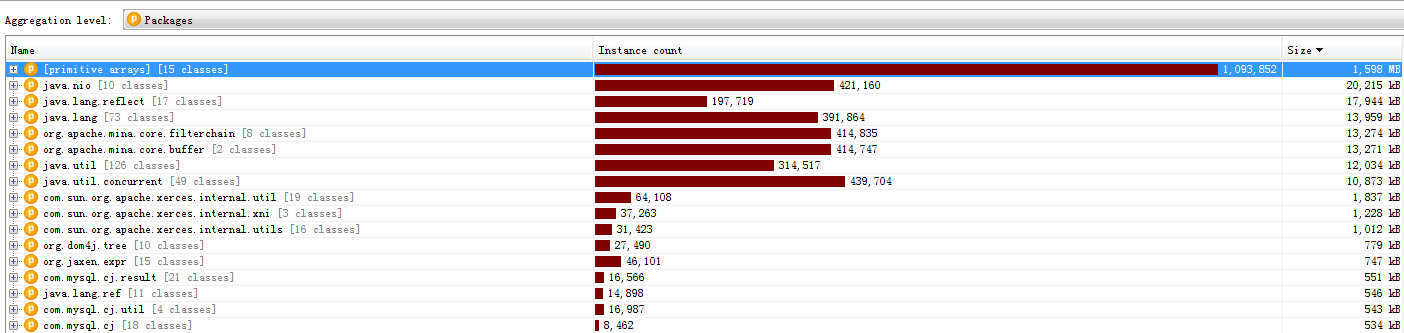
I suggest that you run the test longer, up until almost all memory is consumed, and then generate a heap dump. Alternatively, you can set the HeapDumpOnOutOfMemoryError command line option, which will cause a heap dump to be generated when an OutOfMemoryError occurs.
The heap dump could then be loaded in a tool like Eclipse’s Memory Analyzer (MAT) which will give you to option to find the most likely place where the memory leak is.
Alternatively, if you can make the heap available to me, I can do this analysis.
Today is the Lantern Festival of China, and here I wish you happiness.
I added it in. / openfire / bin / openfire. sh
OPENFIRE_OPTS+="-Xmn256M-Xms1024M-Xmx3072M-XX:+PrintGCDetails-Xloggc:/tmp/openfire-gc.log-XX:+HeapDumpOnOutOfyError"
Running the test, waiting for the server memory overflow, I got these two files. I don’t know if you want them. I’m very grateful to you for answering my question. Thank you very much!?openfire-gc.log (3.5 KB)
openfire-gc(201902191846).log (9.6 KB)
Thank you. I’ll try. Also download a clean openfire for testing。
Although I am unfamiliar with the festival, I hope you will find the time to enjoy it!
I am looking for a different file than the ones that you sent. The Heap Dump is a binary dump of all memory. The file size will be roughly the same size as the amount of memory used by Java (in your case, 2GB).
By default the heap dump is created in a file called java_pidpid.hprof in the working directory of the VM. You can specify an alternative file name or directory with the -XX:HeapDumpPath= option.
Thank you. This bug has a big impact on me. I can’t enjoy it without fixing it, haha. Don’t work too hard, either.
I’ll try this to get the documents you want, but I don’t seem to know much about it. I will try my best. Thank you again.
I downloaded the latest version of openfire(WINDOWS 4.3.2) in Windows, and GitHub downloaded version 4.2.4 of openfire (running on IDEA), which can lead to full memory. I now wonder what configurations I lack. My stress test is that one person is constantly sending messages to another person!
Good night
When I download a new openfire, there will be problems with the original database, but there will be no problems with using a new database.
I’m not sure what your question is.
If i guess correctly he says new version works ok with a fresh databbase/install. But not with old one.
We need to have a heap dump of the problem to see what’s going wrong.
If it is related to a database, then maybe some buffer is filling up, while it is trying to write to a database? A new / clean database might be faster, and not have the problem. I’m just guessing here.
You’re right. I found out that he was doing synchronization lock operation. The query was ofPrivacyList, but after I deleted the data from this table, the new version could run in the old database.
Sorry, I can’t provide what you want, because I really don’t know how to do it. Thank you very much for your help. I’m trying to move my business to openfire 4.2.4 now.