Openfire 3.6.4 runs out of memory every couple of days

Hi,

I’m having an issue where every couple days my Openfire server is running out of memory (java.lang.OutOfMemoryError: Java heap space) and I can’t figure out why.

Here’s my environment information:

Java Version: 1.6.0_14 Sun Microsystems Inc. – Java HotSpot™ 64-Bit Server VM

Appserver: jetty-6.1.x

OS/Hardware: Linux / amd64

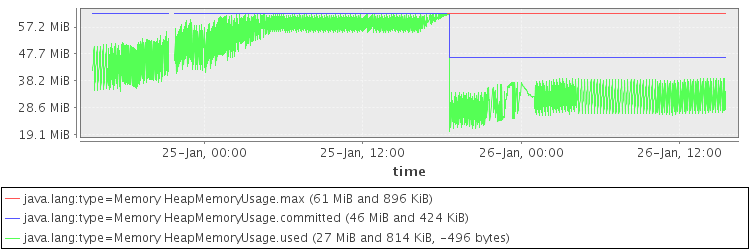
Java Memory: 25.37 MB of 61.88 MB (41.0%) used

And the only two plugins I have installed are:

Search (1.4.3) - I didn’t install this, it just came with the normal install

java-monitor (1.0) - I installed this to help debug this particular issue, but it was happening without this.

I know the java memory is somewhat low, but I have very light usage (max of like 10 or so concurrent users, pretty low stanza communication) and I’ve tried increasing it, which makes the frequency of the crashes lower, but doesn’t stop the root, unchecked inflation of memory.

I’ve also been looking at other threads and I tried some settings from those:

cache.username2roster.maxLifetime = 419430400

xmpp.pep.enabled = false

But they didn’t seem to help, ergo me starting a new discussion.

I’m not sure what to look at or try next. As stated above I have the java-monitor plugin running so I have data from that (not sure how to save a graph and post, or which one to save) but from what I can see it just looks like the heap memory usage starts increasing and doesn’t stop.

Any pointers would be greatly appreciated, including any debugging steps I can take to get additional information. As I said it will crash again in a day or so, so the turnaround for trying something isn’t too high.

Thanks,

\Peter

Quick question for you, are you using MUC or just IM?

Hey, you’ll find a lot of topics like that in here. First of all, tell us about your system. Maybe it is a “Virtual Server”? Whats your RAM? Got unlimited numfile, numproc and kmsize usage?

I’m actually using mainly MUC.

Dear Peter,

On Java-monitor, you can simply use the buttons below each graph to post it on the Java-monitor forum. You should start by posting your heap memory graph on the forum. There is no way to post them on the Ignite Realtime forum directly, so that you would have to by downloading the graph and uploading it to this forum.

With that graph, we might be able to help you better.

Kees Jan

@rene-1: The error message is quite clear that this is a Java issue and I really doubt this is an OS level issue.

I’m using a 1GB slice from slicehost, which gets auto configured with a 2GB swap partition, but it is virtualized. htop (or free or whatever) shows relatively small memory usage (320/1024MB for Mem, 0/2047MB for swap). It’s running Ubuntu Server 8.04.2. I’m pretty sure slicehost doesn’t limit any resource usage directly, how do I find the limits of those items from the kernel if applicable? Any other important configuration items?

Hi Kees Jan,

Thanks for the pointers. I posted it in their “Openfire Administration” forum, and then I downloaded and attached the heap memory graph. It shows the climb upward, then openfire became unresponsive, then I restarted it and its back low again for now, although we have usage periods at certain times so when that starts today I’m expecting it to start climbing again. Also, it seems like it’d be useful to correlate that to some other graphs; i included other ones that appeared interesting to me, let me know if there are others that would be useful.


Dear Peter,

Looking at the heap memory graph I cannot decide whether this is a memory leak, or Openfire just needs more memory to work.

The stanza graph is strange. It looks awfully blocky. The traffic is strangely regular. I am more used to stanza graphs that show only the ‘grass’ and not the blocks. Are there bots connecting to your system? Do you have external components or gateways that connect to this Openfire instance?

I would suggest that you look into who is connecting and what they are doing.

Also, give Openfire some more memory to play with. I’d say aim for 256MB and see what the heap graph does.

Kees Jan

Hi Kees Jan,

I’ll try bumping up the memory and seeing how it behaves.

As far as the stanzas, what magnitude is a lot or a little? There are some service people who sign on, and while they’re online there’s the normal stanzas for BOSH persistence (I think mine are set to refresh ever 120s), and there’s also a pubsub for some service based communications, like a heartbeat. I think those two would generate a flat, blocky graph depending on the people online and if there aren’t many chats (which there aren’t its low volume) then that constant communication would dominate like it appears to be doing. I think that’s okay, as long as the amount of those stanzas aren’t too high right? So is the 25-100 stanzas (per what?) a reasonable level?

As for the items connecting, they’re custom components (I guess you’d call them external components) that are written in-house. They’re basically just group chat interfaces, with a set of people online for a set period of time, customers requesting chats, which generates activity to setup the chat and execute it, and pubsub channels for some state communication. As I said I don’t think these are doing anything crazy, but they are written in house so if the stanza activity seems high that is something I can look at, but it’d be nice to know what I’m trying to target.

Thanks,

\Peter

Hi Peter, this is what caused us problems (we’re also MUC users primarily)…

Visit the ‘Other Settings’ section for your MUC conference. We found that the combination of flush interval and batch size were causing us problems with memory leaks. From what we could work out from the code, everytime someone writes a message in the room it is held in memory until that interval comes around. When it writes it does it in a batch of the specified size. If there are loads of messages going back and forth (as there were in our load test) the backlog of messages to write kept on increasing and increasing till we ran out of memory.

I don’t know if this is a problem that only surfaces with load tests as I’d assume in quiet periods it would eventually calm down and clear down the log. We’ve changed to flush interval 20 and batch size 500 and haven’t seen problems since.

Dear Peter,

The stanza graphs on Java-monitor show the number of stanza’s processed per minute. All graphs have a one minute resolution and show two days of data. 100 stanzas per minute is not a whole lot.

So this Openfire actually sees traffic. Your initial description suggests this is a sleepy Openfire on someone’s ADSL line somewhere. I’m curious to see what happens when you assign more memory to this instance (and the MUC setting changes).

Kees Jan

Hi Mikey,

Sorry about the delay, I had a follow up question to this. What’s the effect of changing the flush interval and batch size? Will it just increase processing usage (since it presumably incurs the overhead of the flush more often) or does it also do something like reduce the amount of time the message is delivered in the history portion of joining a chat room?

Thanks,

\Peter