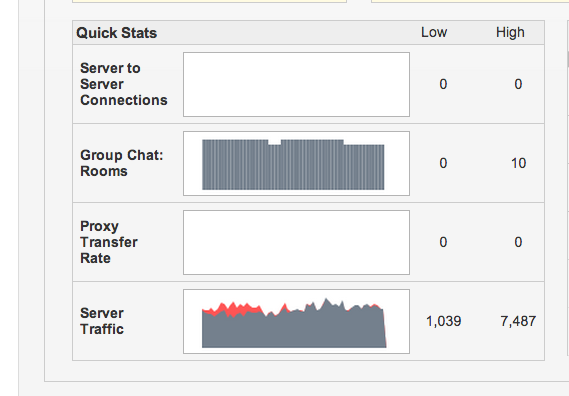
Recently i found the gray area portion almost has same size with the red one. Who can help me know what does the gray area and red area mean in the server traffice portion of the statistics dashboard in admin console?
Recently i found the gray area portion almost has same size with the red one. Who can help me know what does the gray area and red area mean in the server traffice portion of the statistics dashboard in admin console?