We have been running some performance tests on Openfire using JMeter and the XMPP Protocol Support plugin (by BlazeMeter), with some interesting results, finding there is a considerable bottleneck using Hazelcast clustering plugin, let me share the info in case you have any ideas:
Test data:
4000 users
100 roster each
ramp-up: 30 seconds
connect timeout: 10 seconds
Test steps:
Connect to server
Login with user
Set Presence
Get roster
Meaning that in 30 seconds 4000 users must connect to the cluster, set their presence and retrieve their roster.
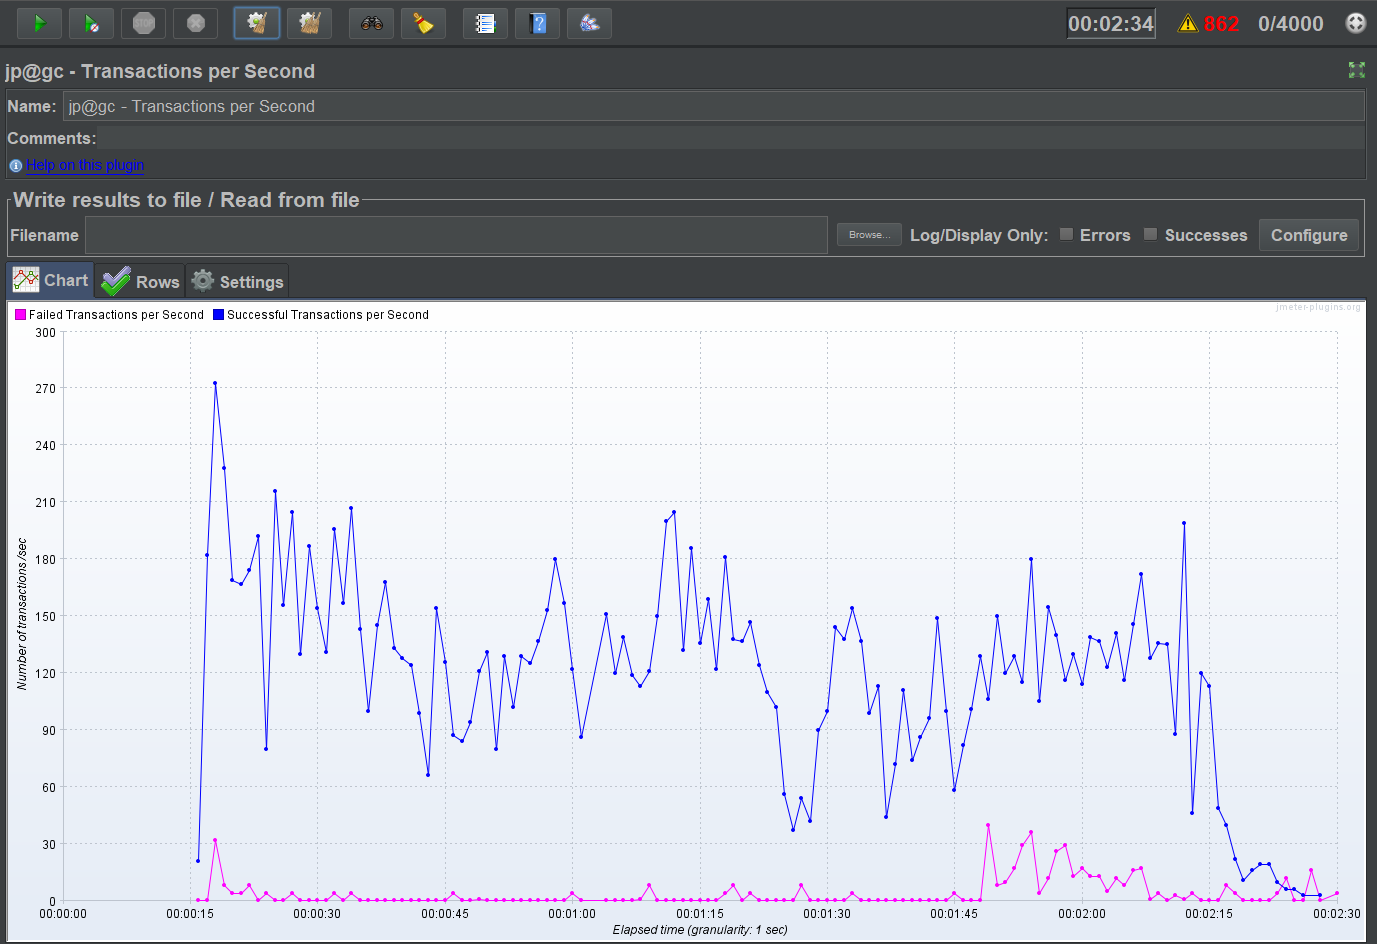
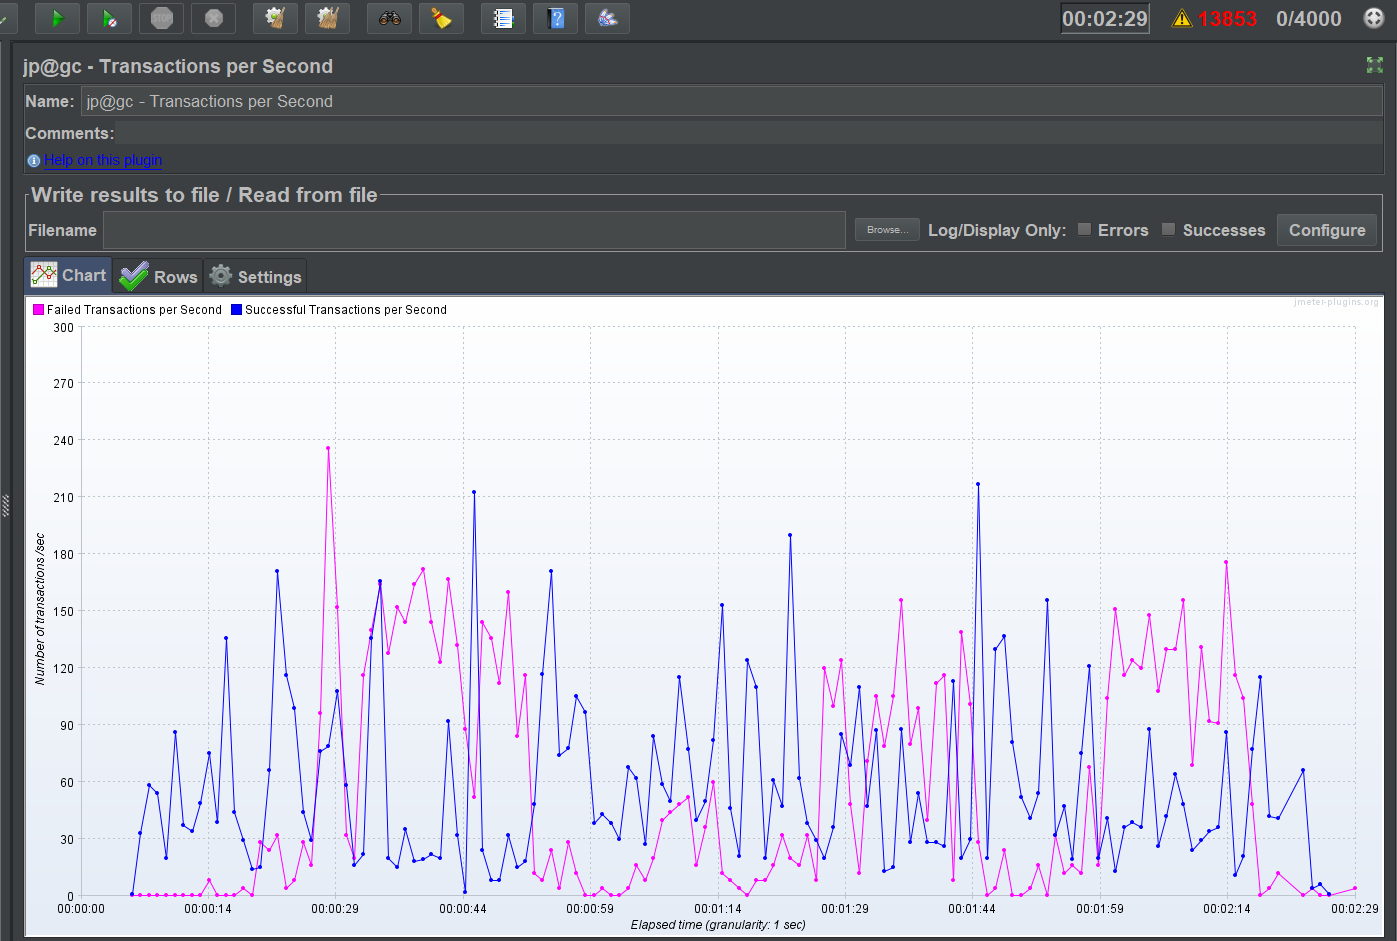
The tests run smoothly without clustering on each node separately, also runs OK in cluster but only with one node connected, the problem arises with both nodes clustered when failed transaction rate goes to the roof. These are the graphics of successful vs failed transactions:
The interesting part about the clustering test comes when we checked what is causing the failing: it is the “3. Set presence” step, for some reason that one is causing the huge failing.
Without it the fail rate drops to 0%
We have been trying to tweak hazelcast cache config and garbace collection settings here and there with no success, if you guys have any idea it will greatly help us to understand.
It means that one of the steps failed, more specific to this test it means that for one user “step 1. Connect to server” failed and hence the remaining steps also failed.
OK, but we really need to know a bit more than “A client attempted to login and failed”. Ideally client and server logs - they’re too big to post here, but somewhere like https://gist.github.com/ would be good.
Well, as you’re only testing, you could try repeating it with SSL disabled, see what sort of results that gives you. Clearly not a longer term solution, but would at least give you some results,