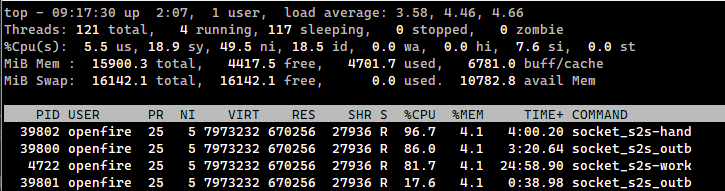
Sorry to hear you’re running into issues. My first advise would be to collect some thread dumps of the Openfire process while it is under heavy load. Comparing them would give us an idea what processes are running. You can create thread dumps using one of the many documented ways of creating thread dumps of Java applications. We also provide an easy-to-use Openfire Thread Dump Plugin for this (which kind of depends on access to the admin console)
Hi Oliver! Thanks, that’s the type of data I was asking for.
Sadly (and somewhat surprisingly) it doesn’t seem to identify a runaway process of sorts. Can you confirm that this was taken while the CPU stats where high?
To dig deeper, it would be helpful to have several consecutive thread dumps taken during the CPU event. For example, take 3 thread dumps ~5 seconds apart. That may allow us to correlate a long-running or frequently running task.
One possible thread to pull on (no pun intended) is the fact that while the JVM has only ~144 live threads, it has created threads with IDs/names reaching as high as 15129. That’s a high number. These seem to be BOSH threads (typically used by web clients). Examples of these are:
Jetty-QTP-BOSH-11009
Jetty-QTP-BOSH-13340
Those threads are currently just selectors waiting for activity.
That means the high thread IDs aren’t themselves evidence that 13,000 BOSH threads currently exist. But they can suggest a process has gone through a lot of thread creation.
I’d like to know:
How long has this JVM been running?
How many BOSH connections are currently established?
Is BOSH actually used by clients?
Which brand/make/model clients are these?
Is there a proxy/load balancer in front of Openfire?
Has the CPU problem correlated with a large increase in HTTP/BOSH requests?
Are clients repeatedly connecting/disconnecting?
Is there a particular client/application generating connection churn?
Is there a non-client network probe firing on the BOSH ports maybe?
Glances showed that the CPU usage was comparable to the screen cap I posted when the thread dump was taken.
The JSXC plugin was installed and enabled. Also, port 7443 was open. However, web clients are not heavily used on the server, so I 1) closed port 7443 2) disabled web client support, and then 3) uninstalled the JSXC plugin. After taking those actions and verifying the CPU usage after each step, the issue seems unchanged using Glances.
The issue seems to appear consistently a few minutes after rebooting the computer hosting the Openfire server, and then persist.
Attached are three consecutive thread dumps taken after uninstalling the JSXC plugin, then rebooting the physical server, and then waiting for the CPU usage to spike.
I found that there were two current remote server connections (one outgoing and one incoming) between two domains in my control that DNS records map to the same static IP address, namely the static IP address where the Openfire server is hosted. Ports 5269 and 5270 were closed. The high CPU usage stopped when I disabled connections to remote servers.
I opened ports 5269 and 5270, and then re-enabled remote server connections with rate limiting enabled using default settings. Currently, there are no remote server connections. CPU usage seems to have returned to normal.
Do you have any concerns about the configuration that I am describing?
Now the same remote server connection has returned. The incoming host is the XMPP domain name. However, I do not know how Openfire is obtaining the outgoing host name. Can you help me track down how or why the connection may be initiated?
Thanks for sharing the additional details. Looking at the thread dumps, I don’t see a clear CPU-spinning thread, but the S2S activity does seem to correlate quite strongly with the high CPU usage.
One possibility worth checking is whether some unexpected or stale roster entry is causing Openfire to route traffic to the remote domain and establish the S2S connection. The roster entry itself wouldn’t directly open the connection, but it could generate presence/subscription traffic that eventually triggers the S2S routing.
Could you have a look at the roster entries for the affected domain? For example:
SELECT * FROM ofRoster WHERE jid LIKE '%@example.org' LIMIT 10;
Replace example.org with the invalid value that you’ve observed.
It would be interesting to see whether there are any unexpected or stale JIDs there, particularly ones that could explain why Openfire is trying to reach that domain. Those would explain why, upon their owners logging in, would generate traffic to the ‘other domain’. Removing those entries (or fixing them to the correct value) may then be a very low-level way of removing the cause of your CPU spikes. Obviously, if you do attempt this, take backups first, and apply modifications only when Openfire is shut down.
Yes, the ofRoster table contained the offending domain name. I gingerly made the edits that you suggested. I’m going to leave the domain name blacklisted as well.
I believe that resolves the issue. Thank you for your help. I’m glad to learn more about Openfire.