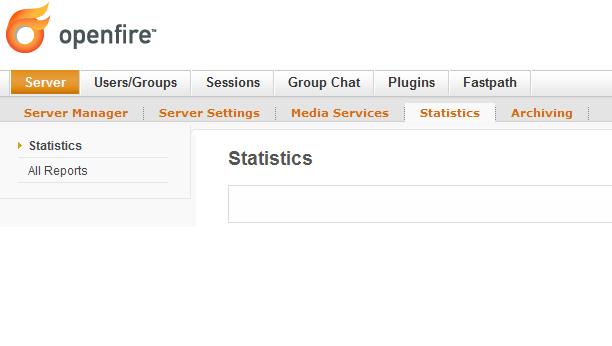
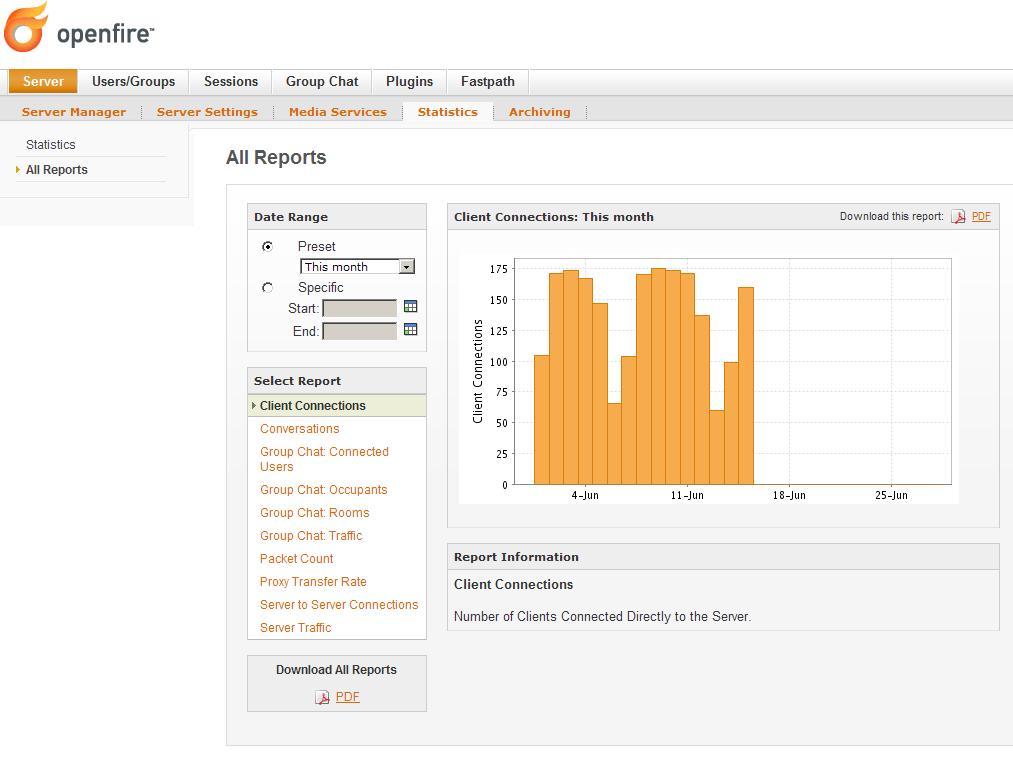
I have been running the Openfire 3.6.4 server on CentOS for a little over a year now. For this entire time I have been using the “Monitoring Service” plugin with no problems until now. I have rebooted CentOS, restarted Openfire, restarted “Monitoring Service” plugin, and still no luck. My problem is in the Admin Console, under Server >> Statistics, the Statistics page does not load with any charts (attached figure1) and provides an error in the log files (attached error.log). When I click on “All Reports” the page loads successfully with charts, but the stats appear to have quit working on June 16, 2010 (attached figure2). Everything under Server >> Archiving is working properly. I turned on log debugging, and restarted the “Monitoring Service” plugin, and then received some output (attached debug.log).
Is anyone able to detect anything that looks wrong, and/or able to provide me with some much appreciated help?
Thanks,
Curt
error.log.zip (1067 Bytes)
debug.log.zip (1219 Bytes)