Why are we not freeing the Buffer allocated after writing message to IoSession in the class path… openfire/xmppserver/src/main/java/org/jivesoftware/openfire/nio/NIOConnection.java
line: IoBuffer buffer = IoBuffer.allocate(4096);
In this I didn’t find any line were we are freeing the allocated byte.
This might be causing memory leakage which in time will consume the entire memory…
In case of “error while delivering packet” can’t we free the allocated buffer?
And in positive scenarios, where are we freeing the allocated buffer?
as we are going to use Openfire I was alarmed by your post and did some quick research.
My impression is: The usage is correct.
Reasons:
The API Doc of Apache Mina does not mention anything about free. Free would be required if Openfire/Mina would use some JNI Method to allocate Memory. For example, if you use a Lib like JOGL, the memory is allocated through the C Library. In Openfire this is not the case. As I understand Mina is configured to use HeapBuffers by default (see class ConnectionManagerImpl and search for “xmpp.socket.heapBuffer”).
Maybe one of the maintainers has a more insight.To me this seems ok.
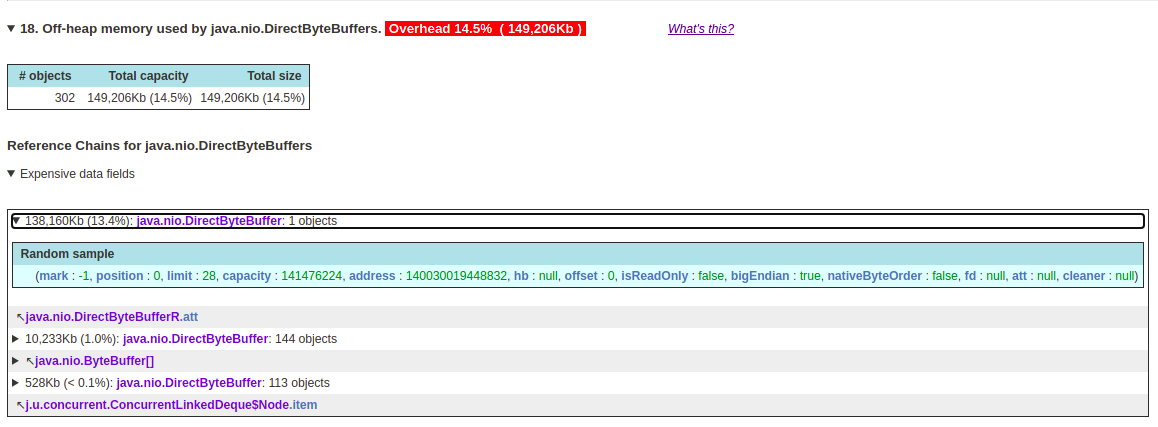
This might not be the reason but I can see some offHeap memory overhead in my heap dump. Also for large TCP connections my free memory keeps on decreasing and it never recovers unless I restart the openfire service.
Yes @gjaekel, I did invoke full GC before the heap dump. I used the following command
jmap -dump:live,format=b,file=mydump.bin
We are planning to include these parameters, but before that we need to figure out IO thread counts and optimal values to set.
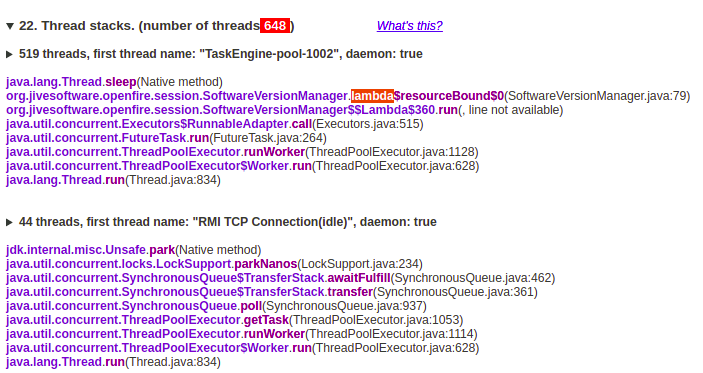
Currently what I noticed is that the overall thread count is very high around 600 most of the time. Out of these, around 500 threads seem to be in the sleep state. I have attached a screenshot of the thread stack trace.
`
Is it due to the high no. of request per second? Is it the same reason that memory consumption is constantly increasing, if so why is it not freeing when request per second decreases?
To my knowledge the jmap-option live will “reduce” the dump to the current tree of simple reachable objects and left out the ready the set of already marked to garbage. This will allow to keep the runtime of this stop-the-world as short as possible and also result in a small dump. But I wonder that – particularly for the recent GC algorithms like G1 – the cost-intensive reclaiming will left out. As long as there’s no pressure, the heap will not be cleaned.
At one of “our” business application, there’s e.g. the fact that some “weak” objects will just be cleared by a FullGC. And because I’m using G1, this will happen very seldom. But this object also contain external resources like the typical set of three unix file handles resulting from a Java stream object. I run into problems with this – not concerning the occupied memory taken by the Java heaps, but by the consumption of file handles. I had to setup an external watchdog that will invoke a FullGC (by jcmd) to comply a certain limit.
Maybe you should publish your current set of JVM runtime parameters here.
I’m not a member of the OpenFire core team, but to my readings of the code, there should be this number of 519 clients the server try to negotiate the XMPP protocol version in the context of establishing a session. The sleep delay defaults to 5s.
IMHO this means that at the time of your heap dump there are more than 500 clients that connect within the last 5s. This you have to correlate and compare to the “real number” of clients that are connecting (or continous re-connecting?)
Hi @gjaekel,
I will try taking a complete heap dump after full GC.
Can you please share some details on how were you able to analyze this memory consumption by the file handles?
Here are my JVM parameters for reference: -Xms8g -Xmx8g -XX:NewRatio=1 -XX:SurvivorRatio=4 -XX:+UseG1GC
In comparison, this take not any notable memory resources (on a Wildfly appserver running a bunch of different applciation with an about 30GB heap). But it arrest attention on the common monitoring because it “needless” occupies file handles in the magnitude of some thousands between the large FGC intervals in the magnitude of days, and overshoot the number of “needed” file handles in high factors. Because it’s slow-growing, an additional cron-driven watchdog just count the number of filehandles for the JVM process and invoke a FGC above a certain “80%” limit. (There is another main watchdog to command graceful or forced restarts at the “95%” levels for all common resources.)
I’m using OpenFire to run OpenMeet (now aka Pàdé), therefore the number of XMPP users is just in the order of hundred. OpenMeet uses two additional “external” JVM to run the Jitsi components.
My current set used for the OpenFire JVM (running at a LXC container with 20Cores assigned to) is:
BTW: Did you ever use (J)VisualVM (+ plugins)? IMHO with it’s live visualization of the GC, memory allocation and threads you can get a good overview and ideas of what’s going on and/or may went wrong.
Also, my server memory consumption increases when TCP connection in my server increases and remains constant there till the TCP connection remains around all time high and even when my TCP connections goes to all time low. This occupied memory never gets free. The next time my TCP connections rises again, my server memory again goes down.
The process continues and it never goes up until I restart the openfire service.
I tried using jcmd (jcmd pid VM.native_memory summary) for memory tracking but I am not able to see any noticeable memory usage in that.
You can. You may use it remote via JMX and then, you have to prepare the JVM by options for this. But in the same way as the j-tools you already used, you may local connect to the unix socket of the running jvm and maybe advance the UI to a remote X11 display. That’s the typical way I use. The JVM used to run JVisualVM itself don’t need much memory.
Will a series of jcmd _pid_ GC.run decrease the amount of occupied memory in long terms, i.e. will this pull down the resources down to some base level each time or will this base increase over the time?
In my described issue at work, the memory resources are neglectable, but the file handle resources are much more limited, especially if they represent IP connections! In my case, there’s a “leftover” of 3 fh’s (two pipes and one selector) per business request and there are about some thousands per day at a base level of about 2000 and a normal fluctuation of about in the hundreds.
Please note that most of the investigation that’s done here seems to relate to memory usage that is expected to occur “on” the heap. The original message indicated that there’s an issue in the “off-heap” memory usage. There’s no clear definition given of what’s “off heap”, but I assume it’s the part of the stack where class definitions and so on occur - stuff that’s re-used by potentially many instances, but not by the data of the individual instances.
I expect that you do not see a linear increase of “off-heap” memory usage over time. Instead, as the system initializes and uses more and more classes, new definitions get loaded in the off-heap memory area, which will remain there. That usage will probably top off.
There are known issues with off-heap memory leakage, but I have no indication that Openfire suffers from one. If it did, then that is unlikely to correspond directly to “more sessions.” Instead, I’d expect potential issues to revolve around the unloading of plugins (where class definitions ought to be removed).
Hi @guus
This is somewhat related to large number of sessions. As there is sharp increase in sessions, memory gets consumed but is never released even if the session decreases until we restart the openfire service.
I have analyzed the some memory sections using -XX:NativeMemoryTracking=summary , I hardly saw much change in memory consumed by threads or internal part. PFA memory data for reference dev-jcmd-Apr4 (3.3 KB)
But while I was analyzing the memory map of the process(pmap), I saw large amount of it occupied. I am still working on what keeps the memory occupied, will let you know once I am able to find it. PFA pmap data for reference dev-pmap-Apr4 (57.5 KB)