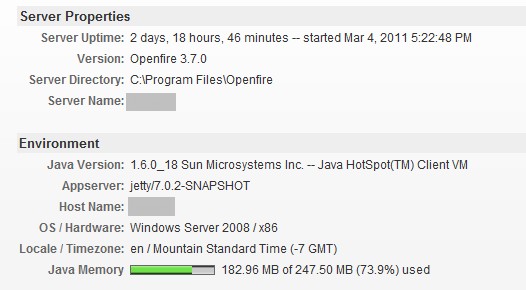
Since the Openfire 3.7 update, the server’s java memory has been 40-50% higher than it was with 3.6. See attachment for environment and details. Anyone know why?
UPDATE: here is the attachment:
Since the Openfire 3.7 update, the server’s java memory has been 40-50% higher than it was with 3.6. See attachment for environment and details. Anyone know why?
UPDATE: here is the attachment:
id you include the attachments? I can’t find any.
This can be caused by any number of changes. A lot of things changed in this respect. I’d be interested in an analysis of your heapdump though. Try creating one and load it in a heapdump analyzer (Eclipse’s MAT is an excellent one - easy to use too). That should tell you what the biggest consumers of memory are. Perhaps that allows me to tell you how you can configure that part.
Geez. forgot to press upload initially. The attachment is above
Hmm… that graph is a bit misleading. It displays the actual memory usage. If you base your memory usage on only that memory-bar, I wonder if you are being thrown off.
The Java VM will allocate memory until this space is full. Then, it’ll do a garbage collect, evicting all allocations that are no longer in use. The proper way (*) of measuring memory usage would therefor be a measurement of memory usage directly after garbage collection. Sadly, Openfire does not make this data available through its admin panel.
You could use a third party tool (jconsole, jprofiler, …) to look at the memory usage directly after garbage collection. Graphs that display memory usage are useful as well, as you can analyze the trend in the ‘jigsaw’ pattern that is typical for garbage collected memory.
Perhaps more importantly: does this hurt you? If memory usage stabilizes, things are typically OK from the applications point of view. More memory usage could simply indicate more caching, which should result in better throughput/performance.
You could of course always tune the available memory using generic Java memory tuning arguments.
(* I am aware that discussions like these could spiral into almost religious discussions pretty fast. It’s the proper way, for this particular context.)
Thanks for the reply. So in my basic understanding of openfire, this meter doesn’t mean much of anything as far as performance and utilization goes? I was wondering why its so much higher than it was on openfire 3.6
I would expect that meter to have (wildly) different readings after each few reloads on a heavily used server. If you compare all of those long enough, you might deduct some trend that indeed indicates increased memory usage - but, as I wrote earlier, that could have any number of reasons (good and bad). As long as your memory consumption stabilizes eventually (which you can’t really deduct from that one bar), I would not worry about it.
I’ll see if I can add some different type of graph in a future release - make things a bit clearer.
Ah: a helpful way to track memory (and other) usage of your Openfire server is to utilize the java-monitor.com provided plugin. I blogged about that one time. It’s easy to set up and gives you interesting statistsics. Look into it if you’re interested.
Thanks
Just to add, that with the older version i was able to see almost complete JVM usage and very low values by hitting refresh on the start page. As Guus said this graph jumps all the time…
We’re seeing this same behavior too, where Java is getting to 99% utilization. To remedy this we’re actually having to restart OpenFire and sometimes even the whole server. We run OpenFire 3.7 on CentOS 5.5 in an ESX 4.0 environment. Kernel version is 2.6.18-238.5.1.el5PAE
Any thoughts?
Ryan,
There are memory leaks with PEP and httpbind , are you using either? Otherwise, there is general memory bloat with MUC.
daryl
Hi Daryl,
Thanks for the quick reply.
It looks like httpdbind is enabled. Should I disable? Also, where is PEP and what is MUC?
Thanks again,
Ryan