Again we got - Too many open files
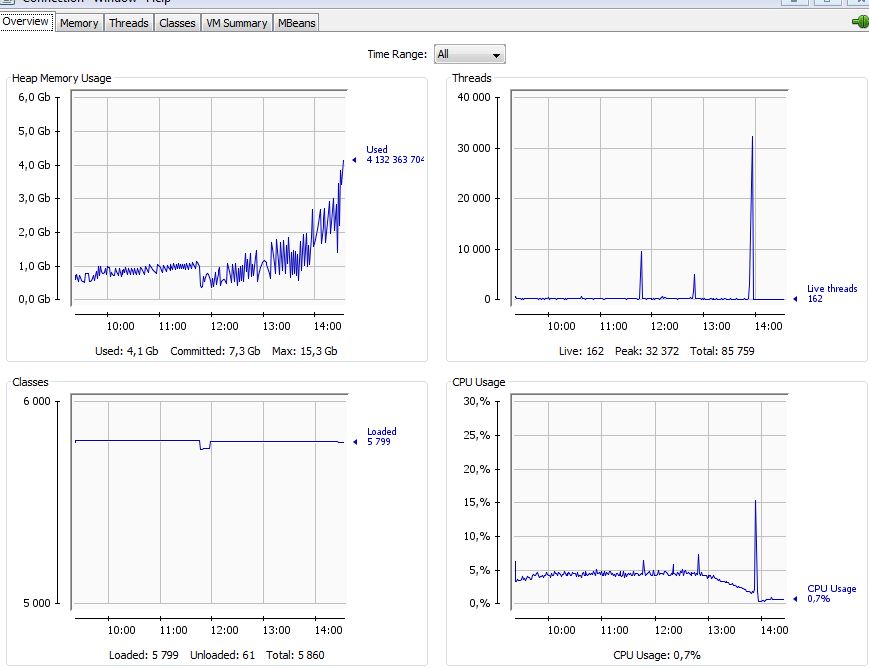
Max thread count shown on picture from Jconsole about 30k,. Is it normal?
5000 users is just for testing, for production will be about 90k users
That last stack trace is a result of our problem, not the cause. I’m not sure about the first one.
What alarms me are all of these lines in your warn.log file:
Unable to deliver a stanza (it is being queued instead), although there are available connections! RID / Connection processing is out of sync!
That could indicate that your clients are doing unexpected things.
Which client implementation are you using? Is that something you created in-house? Also: do clients report any kind of error?
As I said, we use BOSH+strophe.js
Client written using strophe library. And we found some points that missed during creating chat client. As user refeshes page or going to another page - generates new session. It may cause problems?
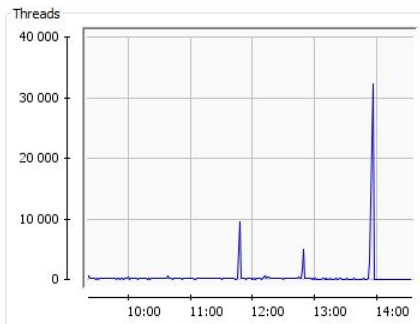
As you can see, thread peeks more that 30k. Every minut we take information such as open files count, netstat and processes
102290 (101965+325 ) - opened files by openfire java proccess (prot+no prot)
101965 - number of sockets with can not identify protocol (half-open connection we call them prot)
325 - other opened files (active sockets and files used by openfire - we call no prot)
total connections taken by netstat is 216, and 17 is TIME_WAIT
proccess by daemon 178
What happened at 11:50? That’s when the problem started to occur.
We dont have logs for that time, just what we take every minute
2016-04-12 11:46
lsof 8798
prot 6698
no prot 2121
netstat-all 9213 time-wait 7196
Proc 236
2016-04-12 11:47
lsof 8846
prot 6724
no prot 2135
netstat-all 9184 time-wait 7133
Proc 928
2016-04-12 11:48
lsof 8798
prot 6699
no prot 2102
netstat-all 9829 time-wait 7808
Proc 9697
2016-04-12 11:49
lsof 8859
prot 6750
no prot 2130
netstat-all 9550 time-wait 7531
Proc 217
2016-04-12 11:50
lsof 8877
prot 6791
no prot 2125
netstat-all 8961 time-wait 6925
Proc 232
2016-04-12 11:51
lsof 8914
prot 6830
no prot 2118
netstat-all 9279 time-wait 7143
Proc 225
2016-04-12 11:52
lsof 8972
prot 6861
no prot 2116
netstat-all 9317 time-wait 7242
Proc 322
Today will try reconfigure log4j for storing log by date, and can provide more information on problem moments
But as you can see at 11:48 process rises to 9627 from 928. its very strange
We count them by - ps -LFu daemon | wc -l
Creating 10k or 33k temporary threads as we see in the Jconsole image is really bad. Configuring less native and Java thread sizes may help to avoid native or Java OutOfMemory errors. Anyhow I’m not sure whether such a would workaround help much.
A javacore file / jstack with the thread names of 10k threads may help much more. Even though it may be hard to trigger one on demand in time.
Do you monitor also the GC usage? I assume that a Full GC at 11:50 unloaded some classes and purged some caches or removed other important references.
At morning we catch “cannot allocate memoty” and when we tried to get jstack our server is freezed. We cant call jstack…
I am tired of this situation, maybe its will better to try to use ejabberd?
There’s very interesting data in this stack trace. I don’t have the time right now to dig deeper, but will try to do so later today.
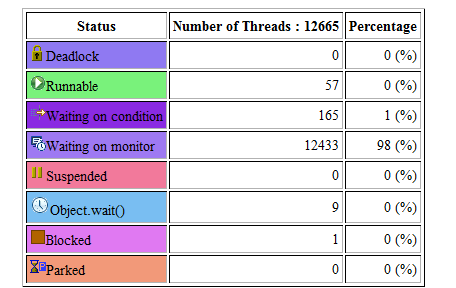
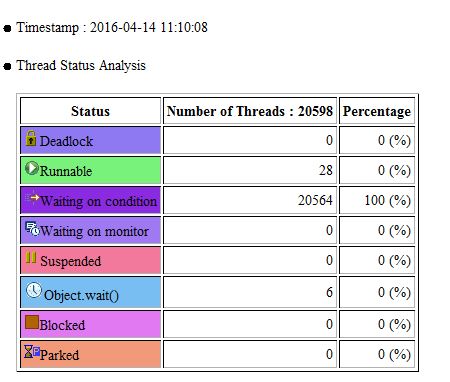
It appears that almost all threads are waiting for this thread to release a lock:
"TaskEngine-pool-34068" #42811 daemon prio=5 os_prio=0 tid=0x00007ff1ed850000 nid=0x1eea runnable [0x00007ff059b27000]
   java.lang.Thread.State: RUNNABLE
        at sun.misc.Unsafe.unpark(Native Method)
        at java.util.concurrent.locks.LockSupport.unpark(LockSupport.java:141)
        at java.util.concurrent.SynchronousQueue$TransferStack$SNode.tryMatch(SynchronousQueue.java:265)
        at java.util.concurrent.SynchronousQueue$TransferStack.transfer(SynchronousQueue.java:383)
        at java.util.concurrent.SynchronousQueue.offer(SynchronousQueue.java:913)
        at java.util.concurrent.ThreadPoolExecutor.execute(ThreadPoolExecutor.java:1361)
        at java.util.concurrent.AbstractExecutorService.submit(AbstractExecutorService.java:112)
        at org.jivesoftware.util.TaskEngine.submit(TaskEngine.java:77)
        at org.jivesoftware.openfire.http.HttpSession.failDelivery(HttpSession.java:1060)
        at org.jivesoftware.openfire.http.HttpSession.closeSession(HttpSession.java:1042)
        - locked <0x00000003cfaf5508> (a java.util.Collections$SynchronizedRandomAccessList)
        at org.jivesoftware.openfire.http.HttpSession.access$800(HttpSession.java:74)
        at org.jivesoftware.openfire.http.HttpSession$HttpVirtualConnection.closeVirtualConnection(HttpSession.java:1111)
        at org.jivesoftware.openfire.net.VirtualConnection.close(VirtualConnection.java:196)
        at org.jivesoftware.openfire.http.HttpSession.close(HttpSession.java:193)
        at org.jivesoftware.openfire.http.HttpSessionManager$HttpSessionReaper.run(HttpSessionManager.java:360)
        at java.util.concurrent.Executors$RunnableAdapter.call(Executors.java:511)
        at java.util.concurrent.FutureTask.run(FutureTask.java:266)
        at java.util.concurrent.ThreadPoolExecutor.runWorker(ThreadPoolExecutor.java:1142)
        at java.util.concurrent.ThreadPoolExecutor$Worker.run(ThreadPoolExecutor.java:617)
        at java.lang.Thread.run(Thread.java:745)
The corresponding piece of code is this:
synchronized (pendingElements) {
    for (Deliverable deliverable : pendingElements) {
        failDelivery(deliverable.getPackets());
    }
    pendingElements.clear();
}
This code, invoked when a session is closed, tries to process data that could not be delivered before the session was closed.
I’m not exactly sure yet why so many threads would block on this lock. I see that there’s a task engine involved - perhaps that’s the cause (‘failing to fail processing, causing a recursive iteration’). Each session should have its own monitor. Is your client re-using the same XMPP user for all clients, perhaps?
“Is your client re-using the same XMPP user for all clients, perhaps?” - i didnt understand at all.
When user loads page - client connecting, and gains SID. When user refresh page or load another page new SID given to user. Old session, closes after idle time. We can see duplicating users sessions. May this can be the main reason of our problem?
Also let me explain our architecture
users connecting to nginx (SSL termination and proxy to http-bind) - Haproxy (for sticky session and balance. Balance openserver nodes in http-mode) - Openserver 4.0.2
now we can take jstack when process rise over 1000.
Here is new jstack on 1278.
test_2016-04-13 18%3A21.zip (32084 Bytes)
Nothing wrong with the code as far as I can tell. I’d say it works as expected and takes some time to complete - after a few seconds the number of threads drops to 1k in JConsole.
I wonder which part of the code is creating (10k) threads after a GC to clean up sessions.
Update: They seem to allocate memory and trigger a GC which takes quite long, that’s why we see the spikes sometimes. There may be an internal job which runs every n minutes or hour to cleanup sessions.
My colleague advises to change in TaskEngine.java
executor = Executors.newCachedThreadPool( threadFactory );
to
executor = Executors.newFixedThreadPool( maxThreads, threadFactory );
And limit threads
test_2016-04-14 11%3A10.zip (441391 Bytes)
Openfire/HttpSession.java at e9a6eb55af4481eff1d75e6a031dfb340ce2c4a0 · igniterealtime/Openfire · GitHub Line :1040 does not seem to be the problem. Anyhow it calls failDelivery(deliverable.getPackets()):1054 and it seems that there the threads are created.
//1040
synchronized (pendingElements) {
    for (Deliverable deliverable : pendingElements) {
        failDelivery(deliverable.getPackets());
    }
    pendingElements.clear();
} //1054
private void failDelivery(final Collection<Packet> packets) {
    if (packets == null) {
        // Do nothing if someone asked to deliver nothing         return;
    }
    // use a separate thread to schedule backup delivery
   TaskEngine.getInstance().submit(new Runnable() {
  @Override
  public void run() {
        for (Packet packet : packets) {
              try {
            backupDeliverer.deliver(packet);
              }
              catch (UnauthorizedException e) {
                  Log.error("Unable to deliver message to backup deliverer", e);
              }
        }
  }
   });
}
The number of threads should be closedSessions * pendingElements.
Not sure why that would need to be done inside of the lock on line 2 though. I still don’t get why there are so many threads locking on that exact same monitor. It appears to be one session causing this.
how to make this problem session find from log or other source?
I still don’t get it. I’m looking at this stack trace:
"TaskEngine-pool-34035" #42778 daemon prio=5 os_prio=0 tid=0x00007ff123890000 nid=0x1ec9 waiting for monitor entry [0x00007ff05c24e000]
   java.lang.Thread.State: BLOCKED (on object monitor)
   at java.util.Collections$SynchronizedCollection.add(Collections.java:2035)
      if (!delivered) {
        if (pendingConnections > 0) {
          Log.warn("Unable to deliver a stanza (...)! RID / Connection processing is out of sync!");
        }
        pendingElements.add(stanza);
      }
   at org.jivesoftware.openfire.http.HttpSession.deliver(HttpSession.java:951)
   - waiting to lock <0x00000003cfaf5508> (a java.util.Collections$SynchronizedRandomAccessList)
   at org.jivesoftware.openfire.http.HttpSession.deliver(HttpSession.java:985)
   at org.jivesoftware.openfire.http.HttpSession.deliver(HttpSession.java:951)   at org.jivesoftware.openfire.session.LocalSession.process(LocalSession.java:320)
   at org.jivesoftware.openfire.spi.RoutingTableImpl.routeToLocalDomain(RoutingTableImpl.java:359)
   at org.jivesoftware.openfire.spi.RoutingTableImpl.routePacket(RoutingTableImpl.java:244)
   at org.jivesoftware.openfire.net.SocketPacketWriteHandler.process(SocketPacketWriteHandler.java:74)
   at org.jivesoftware.openfire.spi.PacketDelivererImpl.deliver(PacketDelivererImpl.java:57)
   at org.jivesoftware.openfire.http.HttpSession$4.run(HttpSession.java:1065)
   at java.util.concurrent.Executors$RunnableAdapter.call(Executors.java:511)
   at java.util.concurrent.FutureTask.run(FutureTask.java:266)
   at java.util.concurrent.ThreadPoolExecutor.runWorker(ThreadPoolExecutor.java:1142)
   at java.util.concurrent.ThreadPoolExecutor$Worker.run(ThreadPoolExecutor.java:617)
   at java.lang.Thread.run(Thread.java:745)
I think that “HttpSession.java:1065 - backupDeliverer.deliver(packet);” is responible for this stacktrace, please correct me if I’m wrong. This would explain why the server crashed.
I think it should call “deliver(OfflinePacketDeliverer.java:49)”. Anyhow in the stack trace we see that it calls “HttpSession.deliver(HttpSession.java:985)”. As it calls itself the thread has to wait until all pendingElements are processed (and temporary stored in 10k other locked threads) just to add it again to pendingElements when the lock is released (like all other threads). This works a few time quite good but as the number of pendingElements increases at one point the server crashes.