Update 12/18/2015 (This original test was for 80,000 users online concurrently. Update is now 120,000 but with no rosters.)
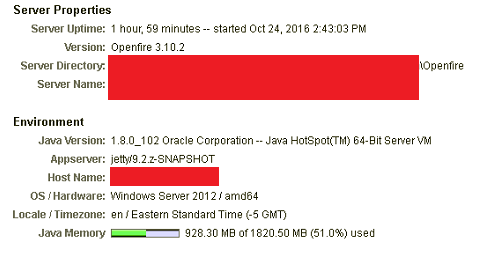
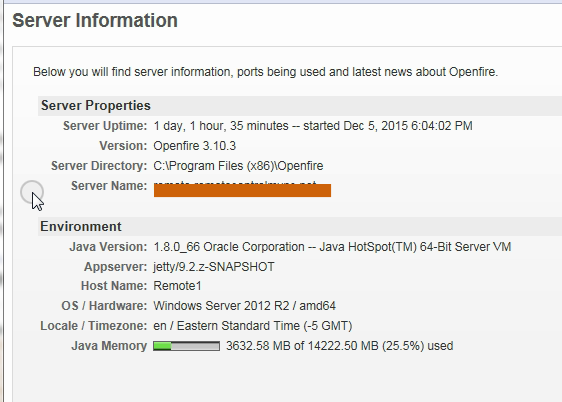
Openfire 3.10.3
(These servers are 6 years old)
OpenFire Server specs: Windows 2012 R2 Server. 64 bit java.
Running OpenFire as a background service. Dual CPUs (Intel Xeon L5420 2.50GHZ. 24GB RAM)
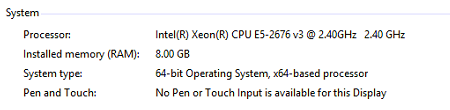
SQL Database Server: Windows 2008 R2 with SQLExpress 2012 (free version of SQL). 8GB RAM Single Xeon E5420 CPU 2.50GHZ
Both servers are using Samsung 850 120GB SSD hard drives. The SQL server has an additional 120GB SSD (D Drive) for the openfire SQL database.
Both servers are not using RAID currently just single drives.
OpenFire Server:
NIC#1 WAN IP Address (3 Linux CentOS Tsung test servers connecting to this IP for the load testing)
NIC#2 LAN IP Address (Used to connect to a Windows 2008 R2 SQLExpress database for OpenFire via LAN in the same room)
SQL server showed almost no cpu usage the entire time. It appeared to be idle for the most part. It handled all requests easily.
Test #1
5-15 roster “friends” for 40k random users. No rosters for other 40k random users.
15 logging in per second with initial presence and roster updates.
72,000 online = 32% cpu
I logged in with spark on my own PC quickly, no delay and roster was updated right away.
Test #2
5-15 roster “friends” for 40k random users. No rosters for other 40k random users.
22.5 users logging in per second with initial presence and roster updates.
10k online 5% cpu
20k online 10% cpu (2gb ram used for java in openfire)
30k online 15% cpu (2gb ram used for java in openfire)
40k online 18% cpu (2gb ram used for java in openfire)
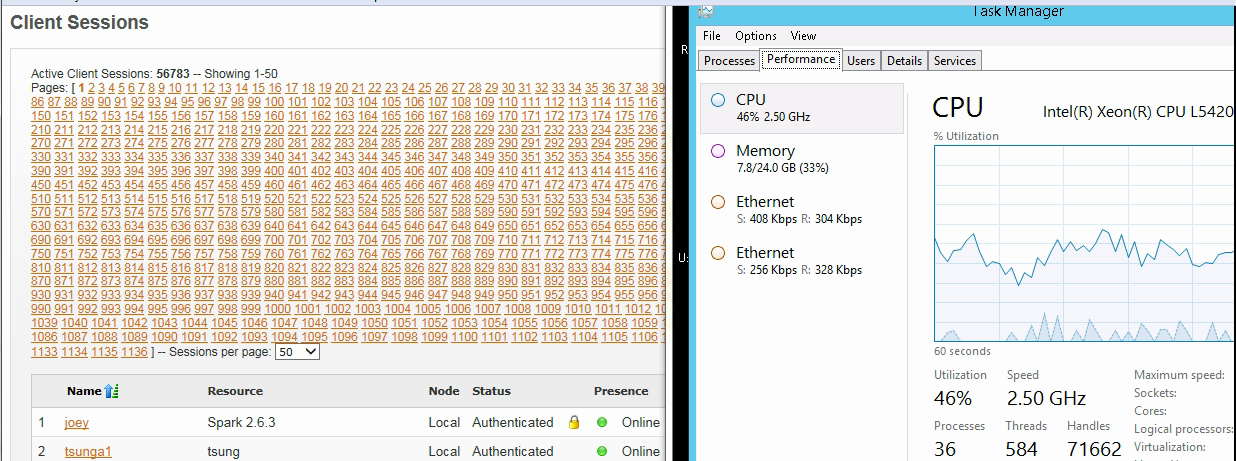
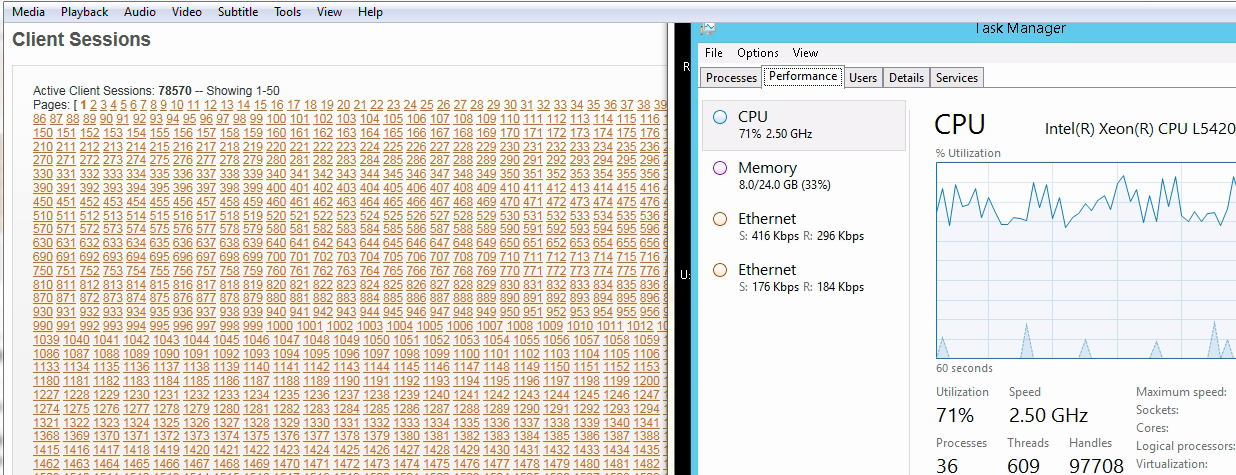
79k online 50% cpu (2gb ram used for java in openfire)
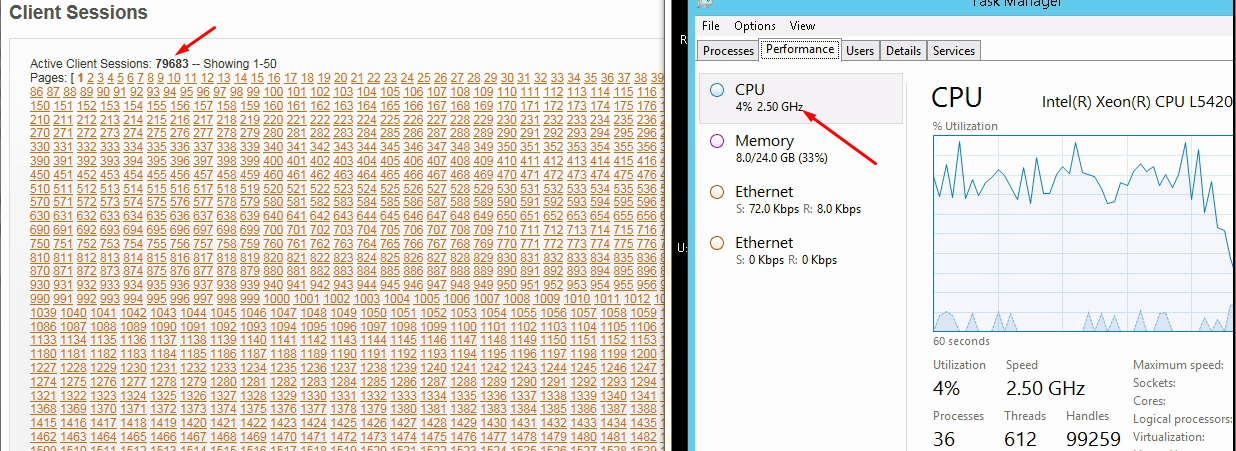
80k online 4% cpu after no more users logging in and no more roster/presence updates
I logged in with spark on my own PC quickly, no delay and roster was updated right away.
Same as above, just higher cpu usage
5-15 rosters for 40k users. No rosters for other 40k
30 logging in per second with initial presence and roster
updates
Tested once and was using just over 2GB RAM used for java in
openfire. 2nd test used 4GB RAM used for java in openfire
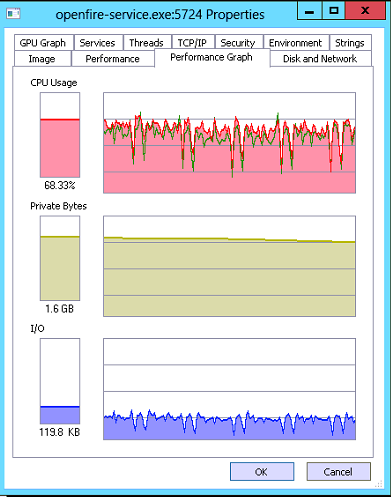
79k online 70% cpu (2gb ram used for java in openfire.
80k online 4% cpu after no more users logging in and no more roster/presence updates
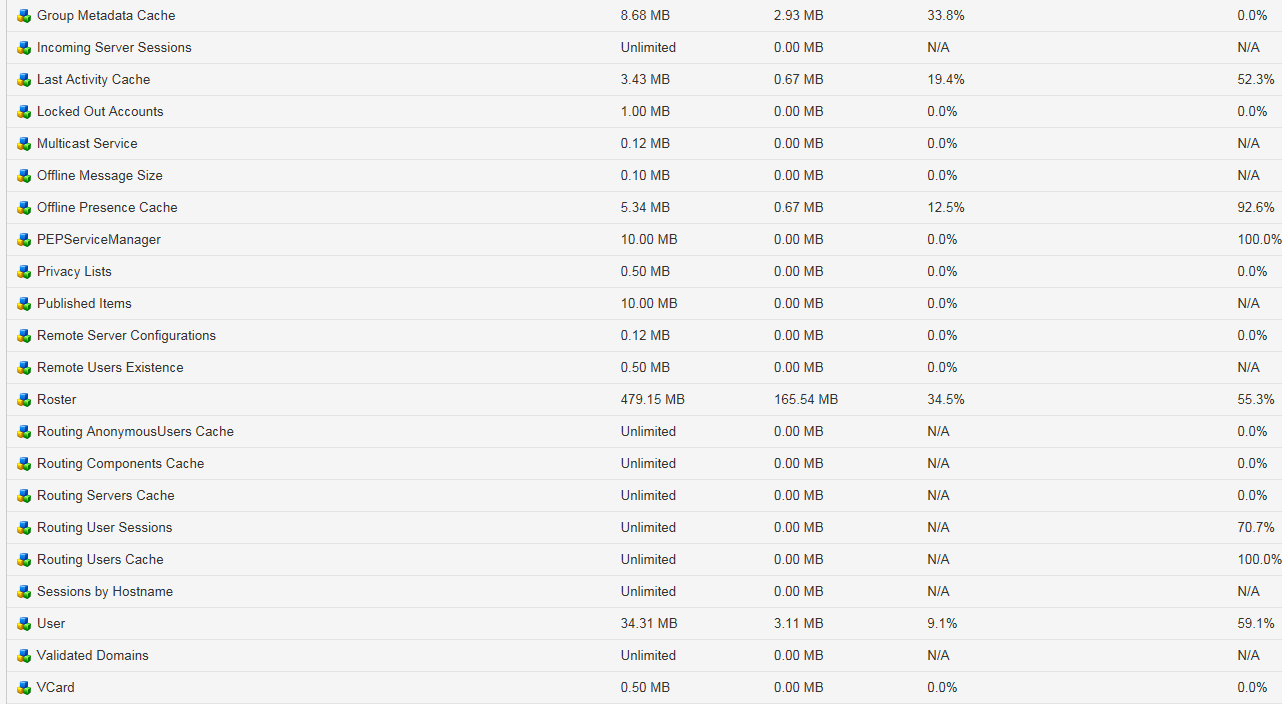
4GB on a second time running this test. OpenFire cache was using this extra RAM so I believe the previous tests caused this memory to be used and not released.
After I stopped the OpenFire service and restarted it, the cache cleared and it ran again with 2GB being used
I logged in with spark on my own PC quickly, no delay and roster was updated right away.
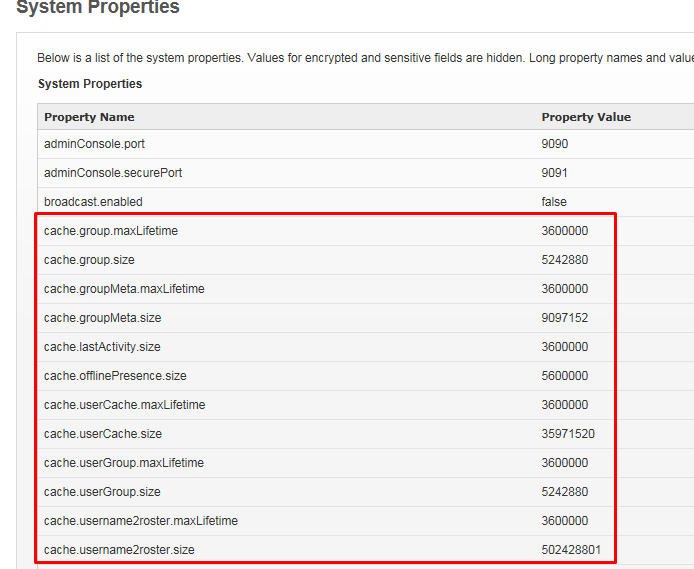
Settings:
CONCLUSION:
If you can manage how many client connections per second are connecting to your server, even some old hardware like I have will do just fine. I should easily be able to do over 150k or 200k assuming I can manage the speed in which users are trying to reconnect which in my case I can because I have a custom jabber client program that all of my users will be using. I wrote a program similar to TeamViewer and Logmein and I use OpenFire to handle the accounts and use the awesome REST API via my webserver where users can sign up and pay for my remote control pc software and choose a plan such as 5 PC license, 10 PC license etc. When they create their account the php script uses REST to send the proper command to the OpenFire server which creates and manages the users and their rosters. I also allow people to share their PCs with other users via the website which again uses REST to modify the rosters of those accounts.
I wanted to see if OpenFire had what it takes to do what I needed without having to purchase a bunch of servers frequently as the user base grew.
I have 4 of these servers and setup the cluster which was also working but I only had 3 additional servers which had Linux CentOS and Tsung installed for the load testing. Each of those servers seemed to cap out at around 27,000 test users concurrently which is why I could only get around 80k in this test. The testing above was not on the cluster, it was only on a single server.
So if you had 4 of these servers ($150 on ebay) and an additional server for load balancing such as one with Linux and HA Proxy, you could send a lot more requests per second.
The other thing to note is that I did a test with 150 users per second logging on and I think by 25k or so online the cpu usage was getting very high and hit 100% soon after if I recall. This was on the same exact server mentioned above.
It is these connections per second that really put pressure on the server and I’m sure if they had even larger rosters, that would compound the issue and add more stress. If you could find a cheap 16 core or 24 core server that is also several years old, I think it would be able to handle 150-200 connections per second with the test I did above. If I had one of these servers I would test it but I do not.