You should be concerened about leaking resources if you don’t want to waste resources.
But really, I recommend using Smack 3.4.1.
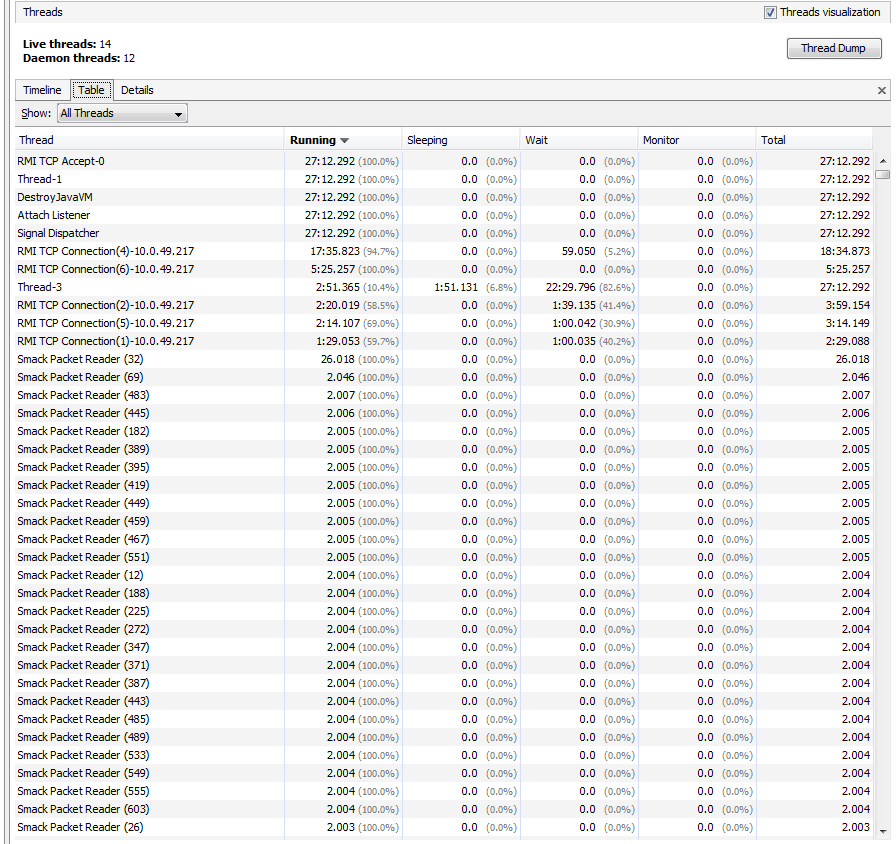
Other then that, the picture shows a bunch of Smack threads. Based on that information it’s even not clear if it’s a memory leak or just a bunch of Connections. What would be interesting to know is the reason those are not gc’ed, i.e. their path to the gc roots.
Even better would be if you would try the latest version of Smack 4.0. I am planing to release a rc1 of Smack 4.0 in about two weeks. Smack 4.0 includes further fixes regarding memory-leaks that didn’t went into 3.4.1 and a bunch of security fixes.
Resource leaking? I am closing the connection correctly, if you mean that:
Connection connection = new XMPPConnection("…");
try {
connection.connect();
connection.login(“xxx”, “xxx”);
} catch (XMPPException e) {
e.printStackTrace();
} finally {
connection.disconnect();
}
The strange thing is, that the thread dump generated by VisualVM looks fine (only 2-3 Smack threads there) and the heap dump looks fine as well (not that many java.lang.Thread instances there).
Nonetheless, it looks strange. That’s why I wanted to ask, if it is something to be concerned about or just a display quirk in VisualVM.
Resource leaking? I am closing the connection correctly, if you mean that:
Oh, I didn’t want to imply that you did something wrong. Just wanted to play with the question “Thread leaking.Should I be concerned?” You should be concerned if you are concerned about resources.
It seems that the output from our VisualVM is somehow confusing. It says
Live Threads 14
Deamon Threads 12
in the top left corner, but the list below shows far more then 26 threads.
just a sanity check… i know JProfiler does, maybe visualvm does as well — it shows both alive and dead threads by default and you must choose a filter to see only “alive” threads. Perhaps you’re looking at a, history of smack threads during your program’s runtime?