We have one annoying issue with openfire. We use Openfire with AD auth and external MariaDB 5.5.41 database, using custom certificate, only TLS.
First, we are trying 3.9.3 with bundled java on windows server 2012 r2 standart (it’s VM with 1 vCpu, 1024 mb RAM), and after 1 day or less openfire service show constant 100% CPU Usage, only helps stop|start service. We are trying update jre version to latest 7u76, but it is not helps.
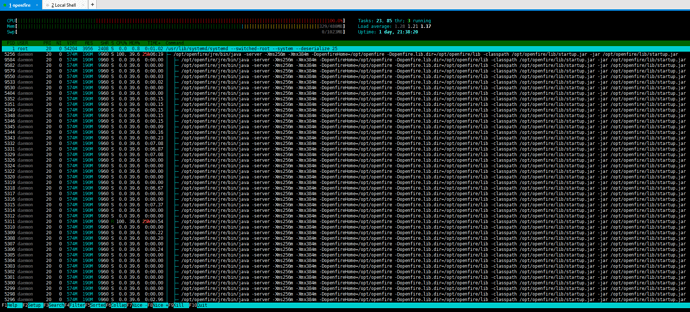
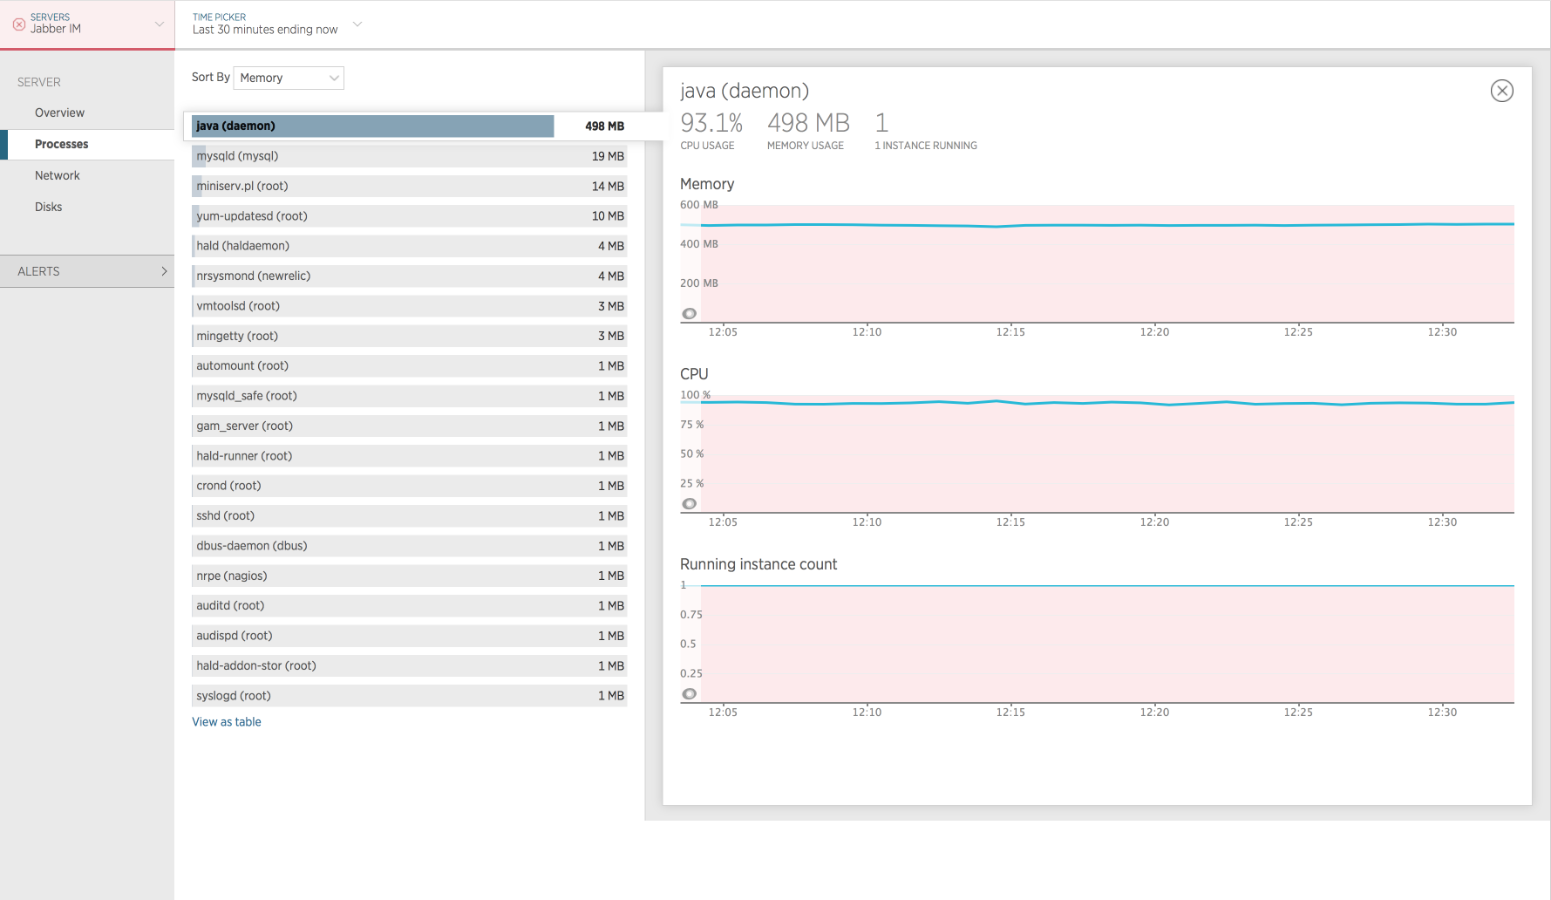
Second, we are install Openfire 3.10 RC on centos7.1 (Linux openfire.local 3.10.0-229.1.2.el7.x86_64 #1 SMP Fri Mar 27 03:04:26 UTC 2015 x86_64 x86_64 x86_64 GNU/Linux) with bundled jre, we have expirience teh same issue - constant 100% cpu usage. Increasing Java Heap upto 384 mb doesn’t help.
Excuse me, but I don’t know how to do this correct. I’am trying to send this code via htop to main openfie process, to certain 100% cpu usage thread, both with no luck. Via command prompt with no luck too. Only kill -9 helps.
the "kill -3 " command will not resolve your issue, or affect Openfire in any way. It is intended to generate information that is useful for debugging purposes. This information will be printed to standard-out (which is commonly captured and saved in a file called no-hup.out). Could you please issue a kill -3 when your instance of Openfire is experiencing the problem, and send us the generated debugging information?
I see the same behavior. In my case, I’m running the RC on Ubuntu 14.04 with OpenJDK 7u51-2.4.6-1ubuntu4. Although CPU tops out at 100% and prevents users from logging in. I’ve observed the symptoms even when I’m the only user logged in-- We’ve only begun testing, and only have 2-3 simultaneous users. Next time it happens I’ll give it a SIGQUIT and see if I get similar debugs.
I wonder which thread causes this problem. Could you post the cpu-times of the threads?
Thread identification
To identify looping threads you should also get one or more stack traces and try to identify the looping thread.
Linux native to java thread mapping
This short manual is for Linux and it may not work on your Linux installation, depending on your kernel and ps versions:
You may want to try to run `ps -T -p openfire-pid -o pid,tid,pri,time | grep -v '00:00:00’´ - this could (depending on your linux ps implementation) display the thread which is using a lot of CPU just like:
PID TID PRI TIME
8313 8313 23 00:00:01
8313 8314 21 00:13:23 <== high “time” value, look at the TID, I use 8314 as a sample value.
8313 8315 23 00:00:04
… very long list, run the command above or `ps -T -p openfire-pid -o pid,tid,pri,time | grep 8314´ again to make sure that this value increases.
Then you would have to look for the “tid” with the highest “time” value and convert it from dec to hex (8314=0x207A ; Linux: printf "%X\n" 8314´; Windows:calc´ with scientific view).
You should find somewhere in the javacore a line with “… nid=0x207A …” - this should be the looping thread.
i was smart to wait and not update right away, same was with 3.9.1 release, what’s the hurry to pile a lot of changes and release it as fast as possible…
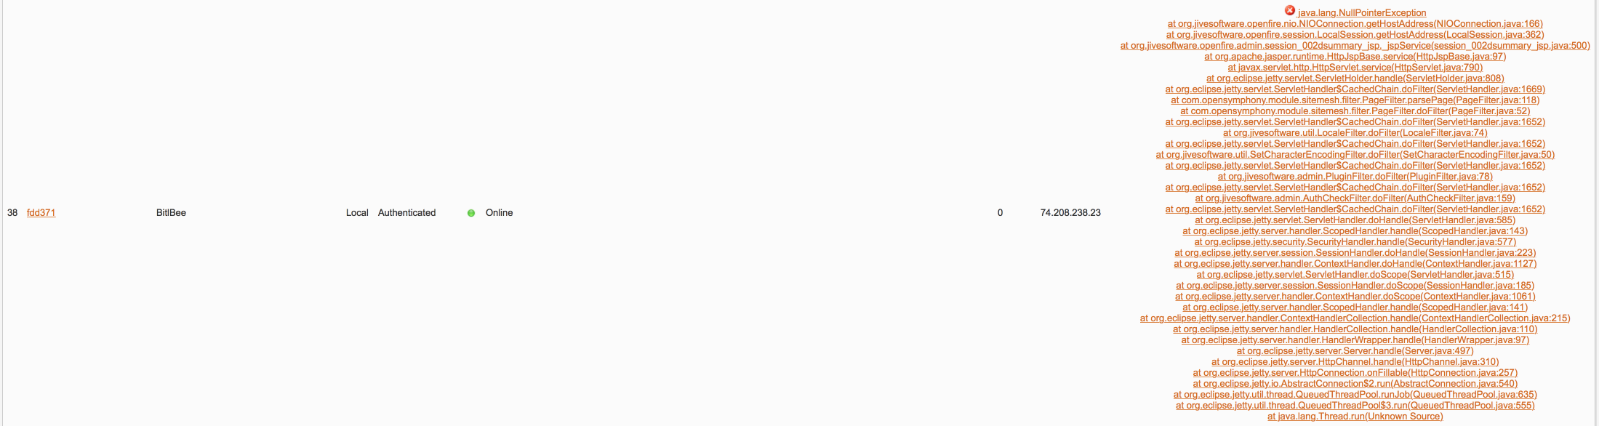
java.lang.NullPointerException
at org.jivesoftware.openfire.nio.NIOConnection.getHostAddress(NIOConnection.java:1 66)
at org.jivesoftware.openfire.session.LocalSession.getHostAddress(LocalSession.java :362)
at org.jivesoftware.openfire.admin.session_002dsummary_jsp._jspService(session_002 dsummary_jsp.java:500)
at org.apache.jasper.runtime.HttpJspBase.service(HttpJspBase.java:97)
at javax.servlet.http.HttpServlet.service(HttpServlet.java:790)
at org.eclipse.jetty.servlet.ServletHolder.handle(ServletHolder.java:808)
at org.eclipse.jetty.servlet.ServletHandler$CachedChain.doFilter(ServletHandler.ja va:1669)
at com.opensymphony.module.sitemesh.filter.PageFilter.parsePage(PageFilter.java:11 8)
at com.opensymphony.module.sitemesh.filter.PageFilter.doFilter(PageFilter.java:52)
at org.eclipse.jetty.servlet.ServletHandler$CachedChain.doFilter(ServletHandler.ja va:1652)
at org.jivesoftware.util.LocaleFilter.doFilter(LocaleFilter.java:74)
at org.eclipse.jetty.servlet.ServletHandler$CachedChain.doFilter(ServletHandler.ja va:1652)
at org.jivesoftware.util.SetCharacterEncodingFilter.doFilter(SetCharacterEncodingF ilter.java:50)
at org.eclipse.jetty.servlet.ServletHandler$CachedChain.doFilter(ServletHandler.ja va:1652)
at org.jivesoftware.admin.PluginFilter.doFilter(PluginFilter.java:78)
at org.eclipse.jetty.servlet.ServletHandler$CachedChain.doFilter(ServletHandler.ja va:1652)
at org.jivesoftware.admin.AuthCheckFilter.doFilter(AuthCheckFilter.java:159)
at org.eclipse.jetty.servlet.ServletHandler$CachedChain.doFilter(ServletHandler.ja va:1652)
at org.eclipse.jetty.servlet.ServletHandler.doHandle(ServletHandler.java:585)
at org.eclipse.jetty.server.handler.ScopedHandler.handle(ScopedHandler.java:143)
at org.eclipse.jetty.security.SecurityHandler.handle(SecurityHandler.java:577)
at org.eclipse.jetty.server.session.SessionHandler.doHandle(SessionHandler.java:22 3)
at org.eclipse.jetty.server.handler.ContextHandler.doHandle(ContextHandler.java:11 27)
at org.eclipse.jetty.servlet.ServletHandler.doScope(ServletHandler.java:515)
at org.eclipse.jetty.server.session.SessionHandler.doScope(SessionHandler.java:185 )
at org.eclipse.jetty.server.handler.ContextHandler.doScope(ContextHandler.java:106 1)
at org.eclipse.jetty.server.handler.ScopedHandler.handle(ScopedHandler.java:141)
at org.eclipse.jetty.server.handler.ContextHandlerCollection.handle(ContextHandler Collection.java:215)
at org.eclipse.jetty.server.handler.HandlerCollection.handle(HandlerCollection.jav a:110)
at org.eclipse.jetty.server.handler.HandlerWrapper.handle(HandlerWrapper.java:97)
at org.eclipse.jetty.server.Server.handle(Server.java:497)
at org.eclipse.jetty.server.HttpChannel.handle(HttpChannel.java:310)
at org.eclipse.jetty.server.HttpConnection.onFillable(HttpConnection.java:257)
at org.eclipse.jetty.io.AbstractConnection$2.run(AbstractConnection.java:540)
at org.eclipse.jetty.util.thread.QueuedThreadPool.runJob(QueuedThreadPool.java:635 )
at org.eclipse.jetty.util.thread.QueuedThreadPool$3.run(QueuedThreadPool.java:555)
at java.lang.Thread.run(Unknown Source)
 java.lang.NullPointerException